Data
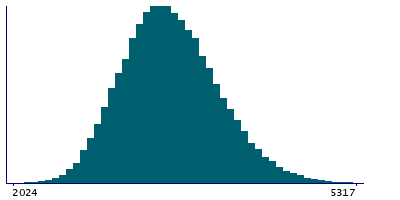
87,996 items of data are available, covering 83,313 participants.
Defined-instances run from 2 to 3, labelled using Instancing
2.
Units of measurement are mm2.
| Maximum | 5944 |
| Decile 9 | 4124 |
| Decile 8 | 3895 |
| Decile 7 | 3739 |
| Decile 6 | 3606 |
| Median | 3488 |
| Decile 4 | 3374 |
| Decile 3 | 3256 |
| Decile 2 | 3123 |
| Decile 1 | 2946 |
| Minimum | 1984 |
|
|
- Mean = 3515.83
- Std.dev = 459.55
- 32 items above graph maximum of 5302
|
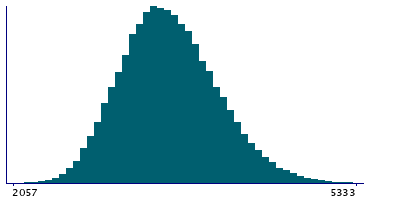
2 Instances
Instance 2 : Imaging visit (2014+)
83,241 participants, 83,241 items
| Maximum | 5944 |
| Decile 9 | 4122 |
| Decile 8 | 3894 |
| Decile 7 | 3738 |
| Decile 6 | 3605 |
| Median | 3487 |
| Decile 4 | 3372 |
| Decile 3 | 3255 |
| Decile 2 | 3121 |
| Decile 1 | 2944 |
| Minimum | 1984 |
|
|
- Mean = 3514.36
- Std.dev = 459.699
- 31 items above graph maximum of 5300
|
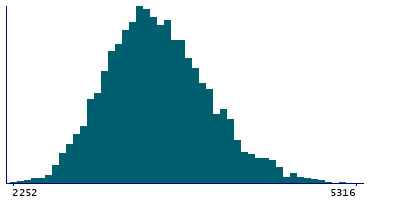
Instance 3 : First repeat imaging visit (2019+)
4,755 participants, 4,755 items
| Maximum | 5455 |
| Decile 9 | 4146.5 |
| Decile 8 | 3916 |
| Decile 7 | 3762 |
| Decile 6 | 3631 |
| Median | 3508.5 |
| Decile 4 | 3398 |
| Decile 3 | 3283 |
| Decile 2 | 3149 |
| Decile 1 | 2977 |
| Minimum | 2252 |
|
|
- Mean = 3541.55
- Std.dev = 456.181
- 1 item above graph maximum of 5316
|
Notes
Area of inferiortemporal in the right hemisphere generated by parcellation of the white surface using DKT parcellation
0 Related Data-Fields
There are no related data-fields
0 Resources
There are no matching Resources
