Data
87,996 items of data are available, covering 83,313 participants.
Defined-instances run from 2 to 3, labelled using Instancing
2.
Units of measurement are mm2.
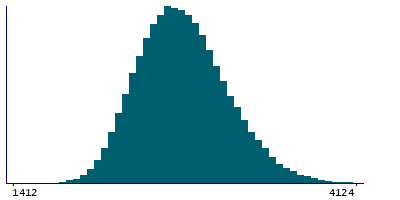
| Maximum | 4746 |
| Decile 9 | 3206 |
| Decile 8 | 3028 |
| Decile 7 | 2908 |
| Decile 6 | 2808 |
| Median | 2716 |
| Decile 4 | 2628 |
| Decile 3 | 2537 |
| Decile 2 | 2436 |
| Decile 1 | 2305 |
| Minimum | 1238 |
|
|
- Mean = 2739.63
- Std.dev = 352.152
- 1 item below graph minimum of 1404
- 46 items above graph maximum of 4107
|
2 Instances
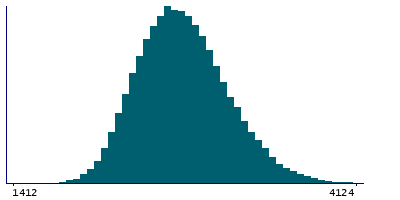
Instance 2 : Imaging visit (2014+)
83,241 participants, 83,241 items
| Maximum | 4746 |
| Decile 9 | 3205 |
| Decile 8 | 3028 |
| Decile 7 | 2907 |
| Decile 6 | 2807 |
| Median | 2715 |
| Decile 4 | 2627 |
| Decile 3 | 2536 |
| Decile 2 | 2435 |
| Decile 1 | 2304 |
| Minimum | 1238 |
|
|
- Mean = 2738.79
- Std.dev = 352.087
- 1 item below graph minimum of 1403
- 44 items above graph maximum of 4106
|
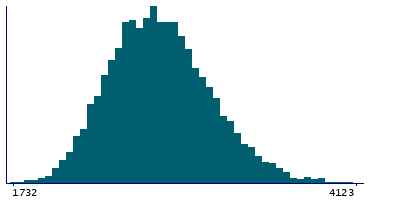
Instance 3 : First repeat imaging visit (2019+)
4,755 participants, 4,755 items
| Maximum | 4204 |
| Decile 9 | 3220.5 |
| Decile 8 | 3047 |
| Decile 7 | 2920.5 |
| Decile 6 | 2826 |
| Median | 2730.5 |
| Decile 4 | 2645 |
| Decile 3 | 2550 |
| Decile 2 | 2451 |
| Decile 1 | 2318 |
| Minimum | 1732 |
|
|
- Mean = 2754.33
- Std.dev = 352.973
- 2 items above graph maximum of 4123
|
Notes
Area of fusiform in the right hemisphere generated by parcellation of the white surface using DKT parcellation
0 Related Data-Fields
There are no related data-fields
0 Resources
There are no matching Resources
