Data
87,996 items of data are available, covering 83,313 participants.
Defined-instances run from 2 to 3, labelled using Instancing
2.
Units of measurement are mm3.
| Maximum | 4403 |
| Decile 9 | 2697 |
| Decile 8 | 2463 |
| Decile 7 | 2307 |
| Decile 6 | 2178 |
| Median | 2064 |
| Decile 4 | 1959.5 |
| Decile 3 | 1852 |
| Decile 2 | 1732.5 |
| Decile 1 | 1583 |
| Minimum | 855 |
|
|
- Mean = 2110.23
- Std.dev = 438.63
- 73 items above graph maximum of 3811
|
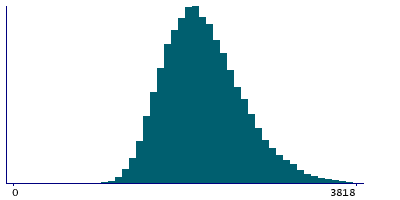
2 Instances
Instance 2 : Imaging visit (2014+)
83,241 participants, 83,241 items
| Maximum | 4403 |
| Decile 9 | 2696 |
| Decile 8 | 2462 |
| Decile 7 | 2306 |
| Decile 6 | 2176.5 |
| Median | 2063 |
| Decile 4 | 1958 |
| Decile 3 | 1851 |
| Decile 2 | 1731 |
| Decile 1 | 1582 |
| Minimum | 855 |
|

|
- Mean = 2108.58
- Std.dev = 438.386
- 66 items above graph maximum of 3810
|
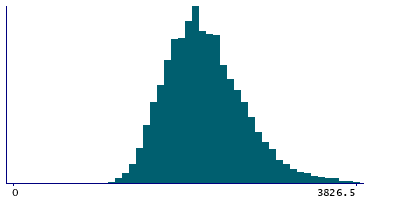
Instance 3 : First repeat imaging visit (2019+)
4,755 participants, 4,755 items
| Maximum | 4176 |
| Decile 9 | 2719 |
| Decile 8 | 2488 |
| Decile 7 | 2324 |
| Decile 6 | 2208 |
| Median | 2091 |
| Decile 4 | 1993 |
| Decile 3 | 1879.5 |
| Decile 2 | 1765 |
| Decile 1 | 1611.5 |
| Minimum | 930 |
|
|
- Mean = 2139.14
- Std.dev = 441.879
- 6 items above graph maximum of 3826.5
|
Notes
Volume of pericalcarine in the left hemisphere generated by parcellation of the white surface using DKT parcellation
0 Related Data-Fields
There are no related data-fields
0 Resources
There are no matching Resources
