Data
87,996 items of data are available, covering 83,313 participants.
Defined-instances run from 2 to 3, labelled using Instancing
2.
Units of measurement are mm3.
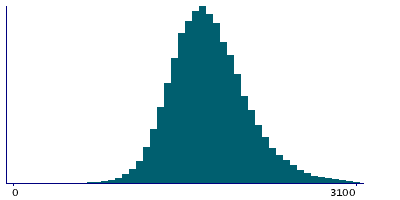
| Maximum | 5276 |
| Decile 9 | 2220 |
| Decile 8 | 2033 |
| Decile 7 | 1914.5 |
| Decile 6 | 1818 |
| Median | 1733 |
| Decile 4 | 1653 |
| Decile 3 | 1569 |
| Decile 2 | 1475 |
| Decile 1 | 1348 |
| Minimum | 54 |
|
|
- Mean = 1766.95
- Std.dev = 366.792
- 434 items above graph maximum of 3092
|
2 Instances
Instance 2 : Imaging visit (2014+)
83,241 participants, 83,241 items
| Maximum | 5276 |
| Decile 9 | 2219 |
| Decile 8 | 2032 |
| Decile 7 | 1914 |
| Decile 6 | 1817 |
| Median | 1733 |
| Decile 4 | 1653 |
| Decile 3 | 1568 |
| Decile 2 | 1474 |
| Decile 1 | 1347 |
| Minimum | 54 |
|
|
- Mean = 1766.1
- Std.dev = 367.029
- 410 items above graph maximum of 3091
|
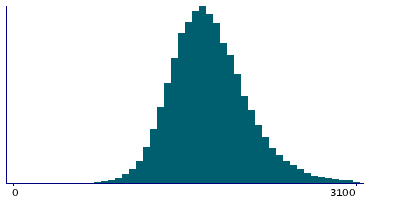
Instance 3 : First repeat imaging visit (2019+)
4,755 participants, 4,755 items
| Maximum | 4014 |
| Decile 9 | 2233 |
| Decile 8 | 2049 |
| Decile 7 | 1927 |
| Decile 6 | 1831 |
| Median | 1745 |
| Decile 4 | 1667 |
| Decile 3 | 1583 |
| Decile 2 | 1494 |
| Decile 1 | 1368 |
| Minimum | 271 |
|

|
- Mean = 1781.86
- Std.dev = 362.299
- 24 items above graph maximum of 3098
|
Notes
Volume of entorhinal in the left hemisphere generated by parcellation of the white surface using DKT parcellation
0 Related Data-Fields
There are no related data-fields
0 Resources
There are no matching Resources
