Data
87,996 items of data are available, covering 83,313 participants.
Defined-instances run from 2 to 3, labelled using Instancing
2.
Units of measurement are mm.
| Maximum | 3.498 |
| Decile 9 | 2.89 |
| Decile 8 | 2.815 |
| Decile 7 | 2.759 |
| Decile 6 | 2.71 |
| Median | 2.664 |
| Decile 4 | 2.618 |
| Decile 3 | 2.568 |
| Decile 2 | 2.508 |
| Decile 1 | 2.424 |
| Minimum | 1.356 |
|
|
- Mean = 2.65977
- Std.dev = 0.183765
- 43 items below graph minimum of 1.958
- 5 items above graph maximum of 3.356
|
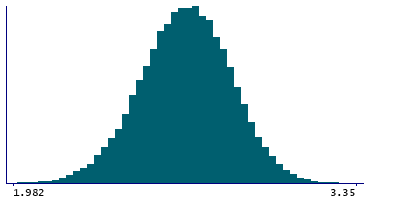
2 Instances
Instance 2 : Imaging visit (2014+)
83,241 participants, 83,241 items
| Maximum | 3.498 |
| Decile 9 | 2.89 |
| Decile 8 | 2.815 |
| Decile 7 | 2.759 |
| Decile 6 | 2.71 |
| Median | 2.664 |
| Decile 4 | 2.618 |
| Decile 3 | 2.567 |
| Decile 2 | 2.507 |
| Decile 1 | 2.423 |
| Minimum | 1.356 |
|

|
- Mean = 2.65934
- Std.dev = 0.184239
- 42 items below graph minimum of 1.956
- 5 items above graph maximum of 3.357
|
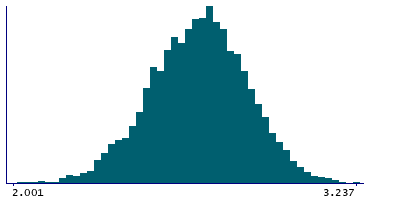
Instance 3 : First repeat imaging visit (2019+)
4,755 participants, 4,755 items
| Maximum | 3.237 |
| Decile 9 | 2.888 |
| Decile 8 | 2.816 |
| Decile 7 | 2.761 |
| Decile 6 | 2.715 |
| Median | 2.673 |
| Decile 4 | 2.628 |
| Decile 3 | 2.577 |
| Decile 2 | 2.52 |
| Decile 1 | 2.4445 |
| Minimum | 1.864 |
|
|
- Mean = 2.66732
- Std.dev = 0.175095
- 4 items below graph minimum of 2.001
|
Notes
Mean thickness of posteriorcingulate in the left hemisphere generated by parcellation of the white surface using DKT parcellation
0 Related Data-Fields
There are no related data-fields
0 Resources
There are no matching Resources
