Data
87,996 items of data are available, covering 83,313 participants.
Defined-instances run from 2 to 3, labelled using Instancing
2.
Units of measurement are mm.
| Maximum | 2.969 |
| Decile 9 | 1.921 |
| Decile 8 | 1.855 |
| Decile 7 | 1.808 |
| Decile 6 | 1.769 |
| Median | 1.733 |
| Decile 4 | 1.697 |
| Decile 3 | 1.658 |
| Decile 2 | 1.612 |
| Decile 1 | 1.55 |
| Minimum | 1.129 |
|
|
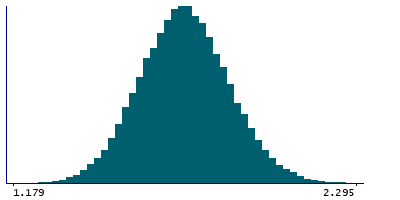
- Mean = 1.73441
- Std.dev = 0.144688
- 2 items below graph minimum of 1.179
- 22 items above graph maximum of 2.292
|
2 Instances
Instance 2 : Imaging visit (2014+)
83,241 participants, 83,241 items
| Maximum | 2.969 |
| Decile 9 | 1.92 |
| Decile 8 | 1.854 |
| Decile 7 | 1.808 |
| Decile 6 | 1.768 |
| Median | 1.732 |
| Decile 4 | 1.696 |
| Decile 3 | 1.657 |
| Decile 2 | 1.611 |
| Decile 1 | 1.549 |
| Minimum | 1.129 |
|

|
- Mean = 1.7338
- Std.dev = 0.144753
- 2 items below graph minimum of 1.178
- 22 items above graph maximum of 2.291
|
Instance 3 : First repeat imaging visit (2019+)
4,755 participants, 4,755 items
| Maximum | 2.288 |
| Decile 9 | 1.929 |
| Decile 8 | 1.862 |
| Decile 7 | 1.818 |
| Decile 6 | 1.778 |
| Median | 1.741 |
| Decile 4 | 1.708 |
| Decile 3 | 1.67 |
| Decile 2 | 1.624 |
| Decile 1 | 1.564 |
| Minimum | 1.192 |
|

|
- Mean = 1.74498
- Std.dev = 0.143125
- 1 item below graph minimum of 1.199
|
Notes
Mean thickness of pericalcarine in the left hemisphere generated by parcellation of the white surface using DKT parcellation
0 Related Data-Fields
There are no related data-fields
0 Resources
There are no matching Resources
