Data
87,996 items of data are available, covering 83,313 participants.
Defined-instances run from 2 to 3, labelled using Instancing
2.
Units of measurement are mm.
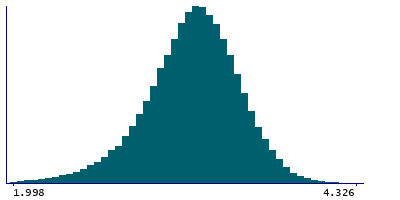
| Maximum | 4.326 |
| Decile 9 | 3.58 |
| Decile 8 | 3.456 |
| Decile 7 | 3.365 |
| Decile 6 | 3.288 |
| Median | 3.213 |
| Decile 4 | 3.137 |
| Decile 3 | 3.049 |
| Decile 2 | 2.938 |
| Decile 1 | 2.762 |
| Minimum | 0.997 |
|
|
- Mean = 3.18495
- Std.dev = 0.337615
- 342 items below graph minimum of 1.944
|
2 Instances
Instance 2 : Imaging visit (2014+)
83,241 participants, 83,241 items
| Maximum | 4.326 |
| Decile 9 | 3.58 |
| Decile 8 | 3.455 |
| Decile 7 | 3.364 |
| Decile 6 | 3.286 |
| Median | 3.212 |
| Decile 4 | 3.135 |
| Decile 3 | 3.047 |
| Decile 2 | 2.936 |
| Decile 1 | 2.76 |
| Minimum | 1.073 |
|

|
- Mean = 3.1831
- Std.dev = 0.338684
- 328 items below graph minimum of 1.94
|
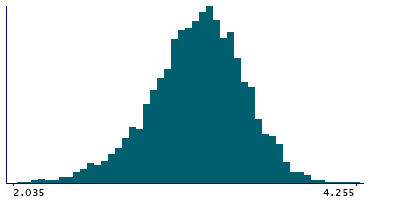
Instance 3 : First repeat imaging visit (2019+)
4,755 participants, 4,755 items
| Maximum | 4.255 |
| Decile 9 | 3.59 |
| Decile 8 | 3.475 |
| Decile 7 | 3.389 |
| Decile 6 | 3.312 |
| Median | 3.241 |
| Decile 4 | 3.164 |
| Decile 3 | 3.084 |
| Decile 2 | 2.977 |
| Decile 1 | 2.8125 |
| Minimum | 0.997 |
|
|
- Mean = 3.21741
- Std.dev = 0.316572
- 17 items below graph minimum of 2.035
|
Notes
Mean thickness of entorhinal in the left hemisphere generated by parcellation of the white surface using DKT parcellation
0 Related Data-Fields
There are no related data-fields
0 Resources
There are no matching Resources
