Data
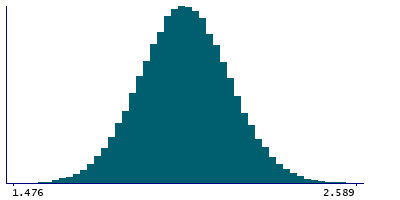
87,996 items of data are available, covering 83,313 participants.
Defined-instances run from 2 to 3, labelled using Instancing
2.
Units of measurement are mm.
| Maximum | 2.764 |
| Decile 9 | 2.215 |
| Decile 8 | 2.151 |
| Decile 7 | 2.105 |
| Decile 6 | 2.066 |
| Median | 2.029 |
| Decile 4 | 1.993 |
| Decile 3 | 1.954 |
| Decile 2 | 1.907 |
| Decile 1 | 1.843 |
| Minimum | 1.377 |
|
|
- Mean = 2.02956
- Std.dev = 0.145846
- 8 items below graph minimum of 1.471
- 15 items above graph maximum of 2.587
|
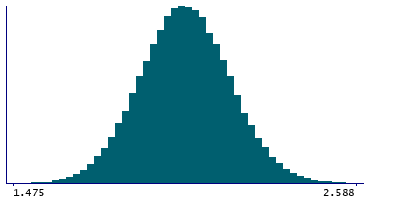
2 Instances
Instance 2 : Imaging visit (2014+)
83,241 participants, 83,241 items
| Maximum | 2.764 |
| Decile 9 | 2.214 |
| Decile 8 | 2.151 |
| Decile 7 | 2.105 |
| Decile 6 | 2.0655 |
| Median | 2.029 |
| Decile 4 | 1.992 |
| Decile 3 | 1.953 |
| Decile 2 | 1.907 |
| Decile 1 | 1.843 |
| Minimum | 1.377 |
|
|
- Mean = 2.02911
- Std.dev = 0.145873
- 8 items below graph minimum of 1.472
- 15 items above graph maximum of 2.585
|
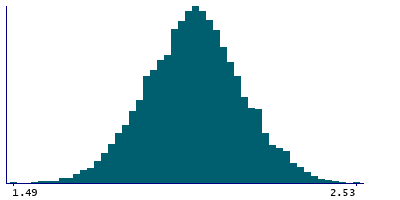
Instance 3 : First repeat imaging visit (2019+)
4,755 participants, 4,755 items
| Maximum | 2.53 |
| Decile 9 | 2.226 |
| Decile 8 | 2.158 |
| Decile 7 | 2.111 |
| Decile 6 | 2.073 |
| Median | 2.039 |
| Decile 4 | 2.003 |
| Decile 3 | 1.964 |
| Decile 2 | 1.914 |
| Decile 1 | 1.8505 |
| Minimum | 1.49 |
|
|
- Mean = 2.03735
- Std.dev = 0.145152
|
Notes
Mean thickness of cuneus in the left hemisphere generated by parcellation of the white surface using DKT parcellation
0 Related Data-Fields
There are no related data-fields
0 Resources
There are no matching Resources
