Data
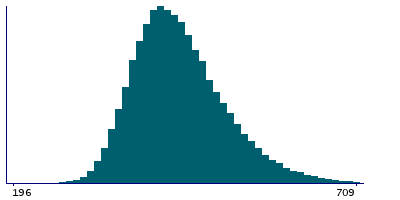
87,996 items of data are available, covering 83,313 participants.
Defined-instances run from 2 to 3, labelled using Instancing
2.
Units of measurement are mm2.
| Maximum | 909 |
| Decile 9 | 532 |
| Decile 8 | 494 |
| Decile 7 | 469 |
| Decile 6 | 450 |
| Median | 433 |
| Decile 4 | 417 |
| Decile 3 | 401 |
| Decile 2 | 383 |
| Decile 1 | 361 |
| Minimum | 196 |
|
|
- Mean = 441.12
- Std.dev = 68.7197
- 194 items above graph maximum of 703
|
2 Instances
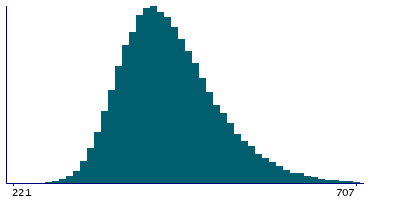
Instance 2 : Imaging visit (2014+)
83,241 participants, 83,241 items
| Maximum | 909 |
| Decile 9 | 532 |
| Decile 8 | 494 |
| Decile 7 | 469 |
| Decile 6 | 449 |
| Median | 432 |
| Decile 4 | 417 |
| Decile 3 | 401 |
| Decile 2 | 383 |
| Decile 1 | 361 |
| Minimum | 221 |
|
|
- Mean = 440.868
- Std.dev = 68.5705
- 176 items above graph maximum of 703
|
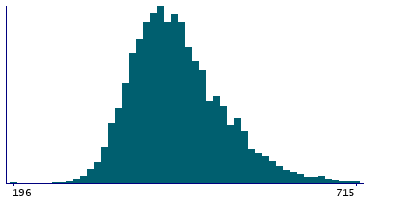
Instance 3 : First repeat imaging visit (2019+)
4,755 participants, 4,755 items
| Maximum | 891 |
| Decile 9 | 539.5 |
| Decile 8 | 501 |
| Decile 7 | 473 |
| Decile 6 | 453 |
| Median | 437 |
| Decile 4 | 419 |
| Decile 3 | 404 |
| Decile 2 | 387 |
| Decile 1 | 365 |
| Minimum | 196 |
|
|
- Mean = 445.53
- Std.dev = 71.1371
- 12 items above graph maximum of 714
|
Notes
Area of transversetemporal in the left hemisphere generated by parcellation of the white surface using DKT parcellation
0 Related Data-Fields
There are no related data-fields
0 Resources
There are no matching Resources
