Data
87,996 items of data are available, covering 83,313 participants.
Defined-instances run from 2 to 3, labelled using Instancing
2.
Units of measurement are mm2.
| Maximum | 6750 |
| Decile 9 | 4357 |
| Decile 8 | 4066 |
| Decile 7 | 3864 |
| Decile 6 | 3698 |
| Median | 3551 |
| Decile 4 | 3411 |
| Decile 3 | 3274 |
| Decile 2 | 3123 |
| Decile 1 | 2925 |
| Minimum | 1784 |
|
|
- Mean = 3605.32
- Std.dev = 565.651
- 90 items above graph maximum of 5789
|
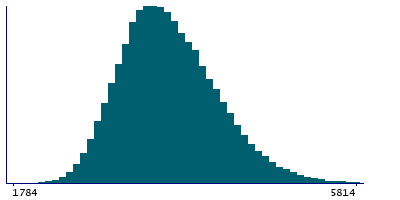
2 Instances
Instance 2 : Imaging visit (2014+)
83,241 participants, 83,241 items
| Maximum | 6750 |
| Decile 9 | 4354 |
| Decile 8 | 4063 |
| Decile 7 | 3861 |
| Decile 6 | 3696 |
| Median | 3549 |
| Decile 4 | 3410 |
| Decile 3 | 3273 |
| Decile 2 | 3121 |
| Decile 1 | 2923 |
| Minimum | 1784 |
|

|
- Mean = 3603.4
- Std.dev = 565.292
- 90 items above graph maximum of 5785
|
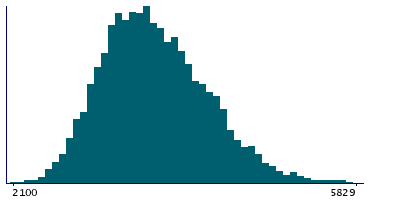
Instance 3 : First repeat imaging visit (2019+)
4,755 participants, 4,755 items
| Maximum | 6256 |
| Decile 9 | 4387.5 |
| Decile 8 | 4121 |
| Decile 7 | 3910.5 |
| Decile 6 | 3736 |
| Median | 3579.5 |
| Decile 4 | 3444 |
| Decile 3 | 3295.5 |
| Decile 2 | 3149 |
| Decile 1 | 2949 |
| Minimum | 2100 |
|
|
- Mean = 3638.94
- Std.dev = 570.855
- 3 items above graph maximum of 5826
|
Notes
Area of supramarginal in the left hemisphere generated by parcellation of the white surface using DKT parcellation
0 Related Data-Fields
There are no related data-fields
0 Resources
There are no matching Resources
