Data
87,996 items of data are available, covering 83,313 participants.
Defined-instances run from 2 to 3, labelled using Instancing
2.
Units of measurement are mm2.
| Maximum | 7494 |
| Decile 9 | 5311 |
| Decile 8 | 5070 |
| Decile 7 | 4899 |
| Decile 6 | 4760 |
| Median | 4636 |
| Decile 4 | 4512 |
| Decile 3 | 4388 |
| Decile 2 | 4247 |
| Decile 1 | 4063 |
| Minimum | 2358 |
|
|
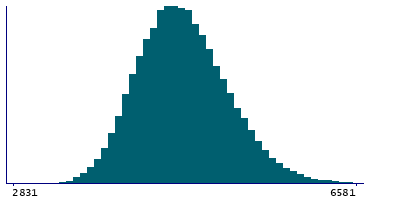
- Mean = 4665.41
- Std.dev = 488.56
- 3 items below graph minimum of 2815
- 52 items above graph maximum of 6559
|
2 Instances
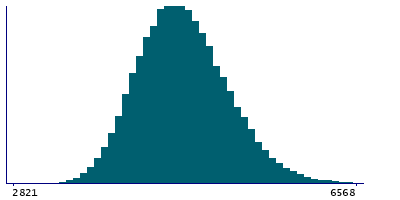
Instance 2 : Imaging visit (2014+)
83,241 participants, 83,241 items
| Maximum | 7494 |
| Decile 9 | 5310 |
| Decile 8 | 5068 |
| Decile 7 | 4899 |
| Decile 6 | 4759.5 |
| Median | 4635 |
| Decile 4 | 4511 |
| Decile 3 | 4387 |
| Decile 2 | 4246 |
| Decile 1 | 4062 |
| Minimum | 2358 |
|
|
- Mean = 4664.41
- Std.dev = 488.888
- 3 items below graph minimum of 2814
- 50 items above graph maximum of 6558
|
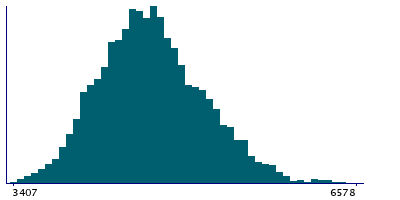
Instance 3 : First repeat imaging visit (2019+)
4,755 participants, 4,755 items
| Maximum | 6838 |
| Decile 9 | 5328.5 |
| Decile 8 | 5093 |
| Decile 7 | 4907.5 |
| Decile 6 | 4769 |
| Median | 4654 |
| Decile 4 | 4534 |
| Decile 3 | 4411.5 |
| Decile 2 | 4274 |
| Decile 1 | 4079 |
| Minimum | 3407 |
|
|
- Mean = 4682.81
- Std.dev = 482.447
- 2 items above graph maximum of 6578
|
Notes
Area of precentral in the left hemisphere generated by parcellation of the white surface using DKT parcellation
0 Related Data-Fields
There are no related data-fields
0 Resources
There are no matching Resources
