Data
87,996 items of data are available, covering 83,313 participants.
Defined-instances run from 2 to 3, labelled using Instancing
2.
Units of measurement are mm2.
| Maximum | 4837 |
| Decile 9 | 1477 |
| Decile 8 | 1388 |
| Decile 7 | 1327 |
| Decile 6 | 1277 |
| Median | 1233 |
| Decile 4 | 1190 |
| Decile 3 | 1146 |
| Decile 2 | 1097 |
| Decile 1 | 1030 |
| Minimum | 390 |
|

|
- Mean = 1245.66
- Std.dev = 178.874
- 5 items below graph minimum of 583
- 101 items above graph maximum of 1924
|
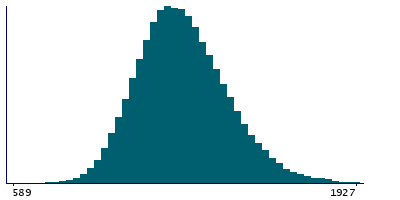
2 Instances
Instance 2 : Imaging visit (2014+)
83,241 participants, 83,241 items
| Maximum | 4837 |
| Decile 9 | 1476 |
| Decile 8 | 1388 |
| Decile 7 | 1326 |
| Decile 6 | 1277 |
| Median | 1232 |
| Decile 4 | 1189 |
| Decile 3 | 1145.5 |
| Decile 2 | 1096 |
| Decile 1 | 1030 |
| Minimum | 390 |
|
|
- Mean = 1245.01
- Std.dev = 179.019
- 5 items below graph minimum of 584
- 95 items above graph maximum of 1922
|
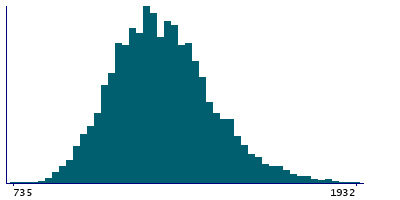
Instance 3 : First repeat imaging visit (2019+)
4,755 participants, 4,755 items
| Maximum | 2023 |
| Decile 9 | 1489 |
| Decile 8 | 1394 |
| Decile 7 | 1337 |
| Decile 6 | 1288 |
| Median | 1242 |
| Decile 4 | 1201 |
| Decile 3 | 1155 |
| Decile 2 | 1108 |
| Decile 1 | 1046 |
| Minimum | 735 |
|
|
- Mean = 1257
- Std.dev = 175.938
- 6 items above graph maximum of 1932
|
Notes
Area of posteriorcingulate in the left hemisphere generated by parcellation of the white surface using DKT parcellation
0 Related Data-Fields
There are no related data-fields
0 Resources
There are no matching Resources
