Data
87,996 items of data are available, covering 83,313 participants.
Defined-instances run from 2 to 3, labelled using Instancing
2.
Units of measurement are mm2.
| Maximum | 3245 |
| Decile 9 | 1870 |
| Decile 8 | 1767 |
| Decile 7 | 1696 |
| Decile 6 | 1640 |
| Median | 1589 |
| Decile 4 | 1541 |
| Decile 3 | 1490 |
| Decile 2 | 1433 |
| Decile 1 | 1359 |
| Minimum | 952 |
|
|
- Mean = 1604.46
- Std.dev = 202.056
- 91 items above graph maximum of 2381
|
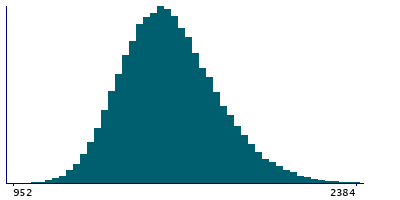
2 Instances
Instance 2 : Imaging visit (2014+)
83,241 participants, 83,241 items
| Maximum | 3245 |
| Decile 9 | 1870 |
| Decile 8 | 1767 |
| Decile 7 | 1696 |
| Decile 6 | 1639 |
| Median | 1588 |
| Decile 4 | 1540 |
| Decile 3 | 1489 |
| Decile 2 | 1432 |
| Decile 1 | 1359 |
| Minimum | 952 |
|

|
- Mean = 1604
- Std.dev = 202.382
- 89 items above graph maximum of 2381
|
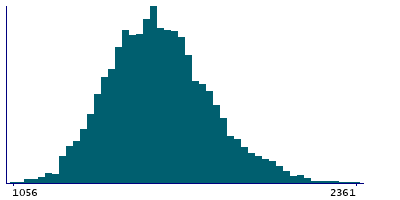
Instance 3 : First repeat imaging visit (2019+)
4,755 participants, 4,755 items
| Maximum | 2507 |
| Decile 9 | 1867.5 |
| Decile 8 | 1772 |
| Decile 7 | 1703 |
| Decile 6 | 1650 |
| Median | 1599 |
| Decile 4 | 1553 |
| Decile 3 | 1500 |
| Decile 2 | 1446 |
| Decile 1 | 1374 |
| Minimum | 1056 |
|
|
- Mean = 1612.67
- Std.dev = 196.079
- 4 items above graph maximum of 2361
|
Notes
Area of paracentral in the left hemisphere generated by parcellation of the white surface using DKT parcellation
0 Related Data-Fields
There are no related data-fields
0 Resources
There are no matching Resources
