Data
87,996 items of data are available, covering 83,313 participants.
Defined-instances run from 2 to 3, labelled using Instancing
2.
Units of measurement are mm2.
| Maximum | 5566 |
| Decile 9 | 3906 |
| Decile 8 | 3689 |
| Decile 7 | 3537 |
| Decile 6 | 3410 |
| Median | 3297 |
| Decile 4 | 3191 |
| Decile 3 | 3080 |
| Decile 2 | 2956 |
| Decile 1 | 2791 |
| Minimum | 790 |
|
|
- Mean = 3328.46
- Std.dev = 437.235
- 1 item below graph minimum of 1676
- 53 items above graph maximum of 5021
|
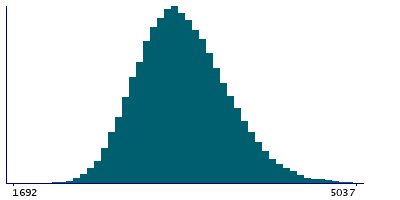
2 Instances
Instance 2 : Imaging visit (2014+)
83,241 participants, 83,241 items
| Maximum | 5566 |
| Decile 9 | 3905 |
| Decile 8 | 3688 |
| Decile 7 | 3536 |
| Decile 6 | 3409 |
| Median | 3295 |
| Decile 4 | 3189 |
| Decile 3 | 3079 |
| Decile 2 | 2954 |
| Decile 1 | 2788 |
| Minimum | 790 |
|

|
- Mean = 3326.96
- Std.dev = 437.878
- 1 item below graph minimum of 1671
- 50 items above graph maximum of 5022
|
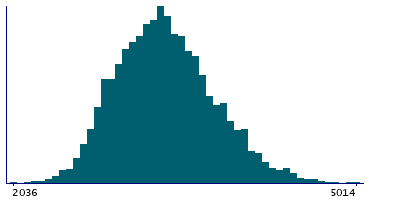
Instance 3 : First repeat imaging visit (2019+)
4,755 participants, 4,755 items
| Maximum | 5285 |
| Decile 9 | 3922 |
| Decile 8 | 3704 |
| Decile 7 | 3558 |
| Decile 6 | 3436 |
| Median | 3329 |
| Decile 4 | 3224 |
| Decile 3 | 3109 |
| Decile 2 | 2985 |
| Decile 1 | 2830 |
| Minimum | 2036 |
|
|
- Mean = 3354.78
- Std.dev = 424.95
- 3 items above graph maximum of 5014
|
Notes
Area of inferiortemporal in the left hemisphere generated by parcellation of the white surface using DKT parcellation
0 Related Data-Fields
There are no related data-fields
0 Resources
There are no matching Resources
