Data
87,996 items of data are available, covering 83,313 participants.
Defined-instances run from 2 to 3, labelled using Instancing
2.
Units of measurement are AU.
| Maximum | 36.532 |
| Decile 9 | 29.0946 |
| Decile 8 | 28.0232 |
| Decile 7 | 27.2223 |
| Decile 6 | 26.5106 |
| Median | 25.8062 |
| Decile 4 | 25.0685 |
| Decile 3 | 24.2332 |
| Decile 2 | 23.1982 |
| Decile 1 | 21.5857 |
| Minimum | 4.152 |
|
|
- Mean = 25.5303
- Std.dev = 3.00064
- 116 items below graph minimum of 14.0768
|
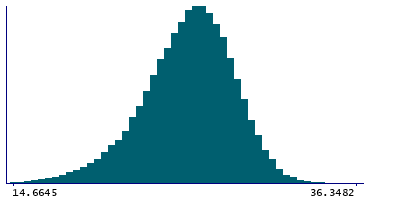
2 Instances
Instance 2 : Imaging visit (2014+)
83,241 participants, 83,241 items
| Maximum | 36.532 |
| Decile 9 | 29.0791 |
| Decile 8 | 28.0055 |
| Decile 7 | 27.1993 |
| Decile 6 | 26.483 |
| Median | 25.7825 |
| Decile 4 | 25.0391 |
| Decile 3 | 24.2064 |
| Decile 2 | 23.1715 |
| Decile 1 | 21.5481 |
| Minimum | 4.152 |
|

|
- Mean = 25.5051
- Std.dev = 3.00764
- 106 items below graph minimum of 14.017
|
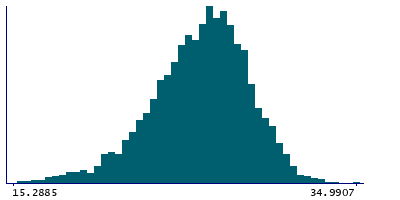
Instance 3 : First repeat imaging visit (2019+)
4,755 participants, 4,755 items
| Maximum | 34.9907 |
| Decile 9 | 29.3227 |
| Decile 8 | 28.329 |
| Decile 7 | 27.5657 |
| Decile 6 | 26.912 |
| Median | 26.2735 |
| Decile 4 | 25.5225 |
| Decile 3 | 24.7437 |
| Decile 2 | 23.7363 |
| Decile 1 | 22.3056 |
| Minimum | 10.1155 |
|
|
- Mean = 25.9717
- Std.dev = 2.83923
- 7 items below graph minimum of 15.2885
|
Notes
Grey-white contrast in entorhinal in the right hemisphere calculated as a percentage of the mean gray-white matter intensity from Desikan-Killiany parcellation
0 Related Data-Fields
There are no related data-fields
0 Resources
There are no matching Resources
