Data
87,996 items of data are available, covering 83,313 participants.
Defined-instances run from 2 to 3, labelled using Instancing
2.
Units of measurement are AU.
| Maximum | 38.469 |
| Decile 9 | 25.5519 |
| Decile 8 | 24.6257 |
| Decile 7 | 23.9733 |
| Decile 6 | 23.4283 |
| Median | 22.9317 |
| Decile 4 | 22.4427 |
| Decile 3 | 21.9165 |
| Decile 2 | 21.3132 |
| Decile 1 | 20.4722 |
| Minimum | 6.5515 |
|
|
- Mean = 22.9817
- Std.dev = 2.01828
- 20 items below graph minimum of 15.3925
- 55 items above graph maximum of 30.6316
|
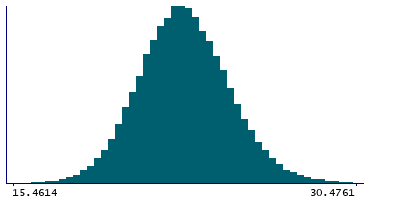
2 Instances
Instance 2 : Imaging visit (2014+)
83,241 participants, 83,241 items
| Maximum | 38.469 |
| Decile 9 | 25.5573 |
| Decile 8 | 24.6265 |
| Decile 7 | 23.9751 |
| Decile 6 | 23.4273 |
| Median | 22.9304 |
| Decile 4 | 22.4408 |
| Decile 3 | 21.9134 |
| Decile 2 | 21.3083 |
| Decile 1 | 20.4663 |
| Minimum | 6.5515 |
|

|
- Mean = 22.9801
- Std.dev = 2.02275
- 18 items below graph minimum of 15.3754
- 54 items above graph maximum of 30.6483
|
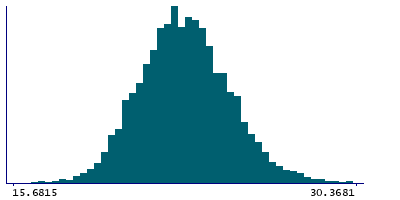
Instance 3 : First repeat imaging visit (2019+)
4,755 participants, 4,755 items
| Maximum | 30.8025 |
| Decile 9 | 25.4726 |
| Decile 8 | 24.6085 |
| Decile 7 | 23.9488 |
| Decile 6 | 23.4522 |
| Median | 22.9616 |
| Decile 4 | 22.4802 |
| Decile 3 | 21.9685 |
| Decile 2 | 21.3856 |
| Decile 1 | 20.577 |
| Minimum | 14.9631 |
|
|
- Mean = 23.0095
- Std.dev = 1.93809
- 2 items below graph minimum of 15.6815
- 1 item above graph maximum of 30.3681
|
Notes
Grey-white contrast in pericalcarine in the left hemisphere calculated as a percentage of the mean gray-white matter intensity from Desikan-Killiany parcellation
0 Related Data-Fields
There are no related data-fields
0 Resources
There are no matching Resources
