Data
87,996 items of data are available, covering 83,313 participants.
Defined-instances run from 2 to 3, labelled using Instancing
2.
Units of measurement are AU.
| Maximum | 37.0502 |
| Decile 9 | 29.1382 |
| Decile 8 | 28.0714 |
| Decile 7 | 27.2473 |
| Decile 6 | 26.531 |
| Median | 25.8273 |
| Decile 4 | 25.1011 |
| Decile 3 | 24.2801 |
| Decile 2 | 23.249 |
| Decile 1 | 21.6867 |
| Minimum | 7.5575 |
|

|
- Mean = 25.5798
- Std.dev = 2.97544
- 116 items below graph minimum of 14.2351
- 1 item above graph maximum of 36.5898
|
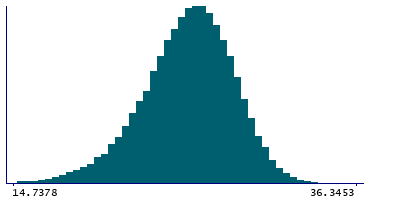
2 Instances
Instance 2 : Imaging visit (2014+)
83,241 participants, 83,241 items
| Maximum | 37.0502 |
| Decile 9 | 29.1157 |
| Decile 8 | 28.049 |
| Decile 7 | 27.2275 |
| Decile 6 | 26.5097 |
| Median | 25.801 |
| Decile 4 | 25.0733 |
| Decile 3 | 24.2509 |
| Decile 2 | 23.2171 |
| Decile 1 | 21.6592 |
| Minimum | 7.5575 |
|
|
- Mean = 25.5542
- Std.dev = 2.9789
- 110 items below graph minimum of 14.2027
- 1 item above graph maximum of 36.5721
|
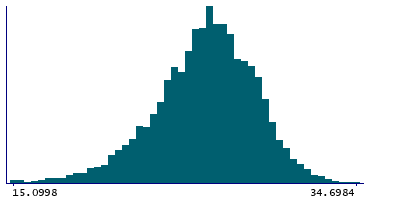
Instance 3 : First repeat imaging visit (2019+)
4,755 participants, 4,755 items
| Maximum | 34.6984 |
| Decile 9 | 29.456 |
| Decile 8 | 28.4503 |
| Decile 7 | 27.5975 |
| Decile 6 | 26.9038 |
| Median | 26.2592 |
| Decile 4 | 25.5805 |
| Decile 3 | 24.8004 |
| Decile 2 | 23.8336 |
| Decile 1 | 22.2785 |
| Minimum | 11.5732 |
|
|
- Mean = 26.0279
- Std.dev = 2.87757
- 3 items below graph minimum of 15.1011
|
Notes
Grey-white contrast in entorhinal in the left hemisphere calculated as a percentage of the mean gray-white matter intensity from Desikan-Killiany parcellation
0 Related Data-Fields
There are no related data-fields
0 Resources
There are no matching Resources
