Data
87,996 items of data are available, covering 83,313 participants.
Defined-instances run from 2 to 3, labelled using Instancing
2.
Units of measurement are mm2.
| Maximum | 819 |
| Decile 9 | 525 |
| Decile 8 | 486 |
| Decile 7 | 459 |
| Decile 6 | 437 |
| Median | 418 |
| Decile 4 | 401 |
| Decile 3 | 383 |
| Decile 2 | 364 |
| Decile 1 | 340 |
| Minimum | 71 |
|

|
- Mean = 426.667
- Std.dev = 73.5047
- 99 items above graph maximum of 710
|
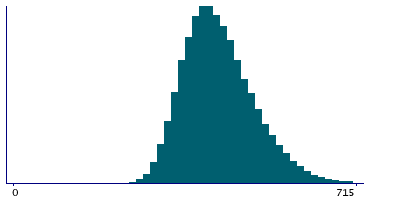
2 Instances
Instance 2 : Imaging visit (2014+)
83,241 participants, 83,241 items
| Maximum | 819 |
| Decile 9 | 525 |
| Decile 8 | 485 |
| Decile 7 | 458 |
| Decile 6 | 437 |
| Median | 418 |
| Decile 4 | 401 |
| Decile 3 | 383 |
| Decile 2 | 364 |
| Decile 1 | 340 |
| Minimum | 71 |
|
|
- Mean = 426.481
- Std.dev = 73.421
- 94 items above graph maximum of 710
|
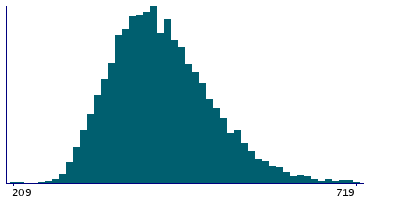
Instance 3 : First repeat imaging visit (2019+)
4,755 participants, 4,755 items
| Maximum | 809 |
| Decile 9 | 530 |
| Decile 8 | 490 |
| Decile 7 | 462 |
| Decile 6 | 441 |
| Median | 421 |
| Decile 4 | 404 |
| Decile 3 | 385 |
| Decile 2 | 366 |
| Decile 1 | 341 |
| Minimum | 209 |
|
|
- Mean = 429.91
- Std.dev = 74.8796
- 4 items above graph maximum of 719
|
Notes
Area of transversetemporal in the right hemisphere generated by parcellation of the pial surface using Desikan-Killiany parcellation
0 Related Data-Fields
There are no related data-fields
0 Resources
There are no matching Resources
