Data
87,996 items of data are available, covering 83,313 participants.
Defined-instances run from 2 to 3, labelled using Instancing
2.
Units of measurement are mm2.
| Maximum | 1061 |
| Decile 9 | 588 |
| Decile 8 | 557 |
| Decile 7 | 535 |
| Decile 6 | 518 |
| Median | 501 |
| Decile 4 | 486 |
| Decile 3 | 469 |
| Decile 2 | 451 |
| Decile 1 | 426 |
| Minimum | 252 |
|
|
- Mean = 504.866
- Std.dev = 64.5213
- 1 item below graph minimum of 264
- 104 items above graph maximum of 750
|
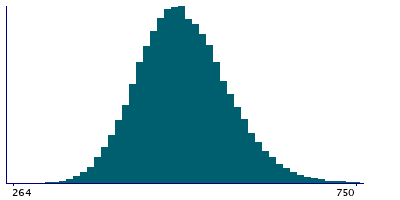
2 Instances
Instance 2 : Imaging visit (2014+)
83,241 participants, 83,241 items
| Maximum | 1061 |
| Decile 9 | 588 |
| Decile 8 | 557 |
| Decile 7 | 536 |
| Decile 6 | 518 |
| Median | 501 |
| Decile 4 | 486 |
| Decile 3 | 469 |
| Decile 2 | 451 |
| Decile 1 | 426 |
| Minimum | 273 |
|

|
- Mean = 504.931
- Std.dev = 64.5911
- 100 items above graph maximum of 750
|
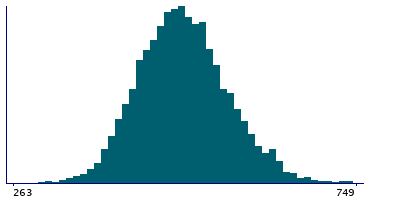
Instance 3 : First repeat imaging visit (2019+)
4,755 participants, 4,755 items
| Maximum | 793 |
| Decile 9 | 587 |
| Decile 8 | 555 |
| Decile 7 | 534 |
| Decile 6 | 517 |
| Median | 501 |
| Decile 4 | 486 |
| Decile 3 | 469 |
| Decile 2 | 450 |
| Decile 1 | 425 |
| Minimum | 252 |
|
|
- Mean = 503.737
- Std.dev = 63.2763
- 1 item below graph minimum of 263
- 4 items above graph maximum of 749
|
Notes
Area of frontalpole in the right hemisphere generated by parcellation of the pial surface using Desikan-Killiany parcellation
0 Related Data-Fields
There are no related data-fields
0 Resources
There are no matching Resources
