Data
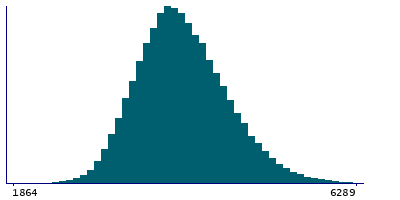
87,996 items of data are available, covering 83,313 participants.
Defined-instances run from 2 to 3, labelled using Instancing
2.
Units of measurement are mm2.
| Maximum | 7577 |
| Decile 9 | 4798 |
| Decile 8 | 4504 |
| Decile 7 | 4301 |
| Decile 6 | 4136 |
| Median | 3989 |
| Decile 4 | 3849 |
| Decile 3 | 3707 |
| Decile 2 | 3544 |
| Decile 1 | 3328 |
| Minimum | 1241 |
|
|
- Mean = 4033.41
- Std.dev = 578.731
- 3 items below graph minimum of 1858
- 70 items above graph maximum of 6268
|
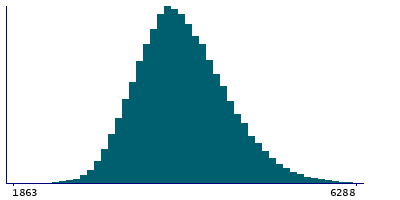
2 Instances
Instance 2 : Imaging visit (2014+)
83,241 participants, 83,241 items
| Maximum | 7577 |
| Decile 9 | 4797 |
| Decile 8 | 4502 |
| Decile 7 | 4300 |
| Decile 6 | 4135 |
| Median | 3987 |
| Decile 4 | 3847 |
| Decile 3 | 3705 |
| Decile 2 | 3542 |
| Decile 1 | 3326 |
| Minimum | 1241 |
|
|
- Mean = 4031.62
- Std.dev = 578.576
- 3 items below graph minimum of 1855
- 64 items above graph maximum of 6268
|
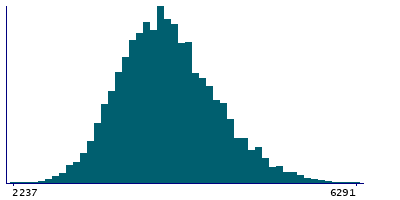
Instance 3 : First repeat imaging visit (2019+)
4,755 participants, 4,755 items
| Maximum | 6988 |
| Decile 9 | 4823 |
| Decile 8 | 4533 |
| Decile 7 | 4325 |
| Decile 6 | 4165 |
| Median | 4021.5 |
| Decile 4 | 3886 |
| Decile 3 | 3737 |
| Decile 2 | 3576 |
| Decile 1 | 3355 |
| Minimum | 2237 |
|
|
- Mean = 4064.75
- Std.dev = 580.55
- 5 items above graph maximum of 6291
|
Notes
Area of supramarginal in the right hemisphere generated by parcellation of the pial surface using Desikan-Killiany parcellation
0 Related Data-Fields
There are no related data-fields
0 Resources
There are no matching Resources
