Data
87,996 items of data are available, covering 83,313 participants.
Defined-instances run from 2 to 3, labelled using Instancing
2.
Units of measurement are mm2.
| Maximum | 2557 |
| Decile 9 | 1639 |
| Decile 8 | 1510 |
| Decile 7 | 1424 |
| Decile 6 | 1356 |
| Median | 1294 |
| Decile 4 | 1237 |
| Decile 3 | 1180 |
| Decile 2 | 1117 |
| Decile 1 | 1037 |
| Minimum | 553 |
|

|
- Mean = 1319.07
- Std.dev = 236.112
- 64 items above graph maximum of 2241
|
2 Instances
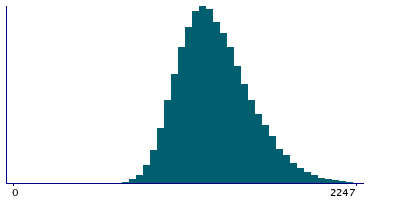
Instance 2 : Imaging visit (2014+)
83,241 participants, 83,241 items
| Maximum | 2557 |
| Decile 9 | 1639 |
| Decile 8 | 1510 |
| Decile 7 | 1424 |
| Decile 6 | 1355 |
| Median | 1293 |
| Decile 4 | 1236 |
| Decile 3 | 1180 |
| Decile 2 | 1117 |
| Decile 1 | 1036 |
| Minimum | 553 |
|
|
- Mean = 1318.76
- Std.dev = 236.226
- 62 items above graph maximum of 2242
|
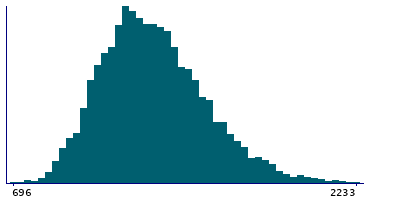
Instance 3 : First repeat imaging visit (2019+)
4,755 participants, 4,755 items
| Maximum | 2459 |
| Decile 9 | 1639 |
| Decile 8 | 1513 |
| Decile 7 | 1428 |
| Decile 6 | 1363 |
| Median | 1300 |
| Decile 4 | 1243 |
| Decile 3 | 1187.5 |
| Decile 2 | 1123 |
| Decile 1 | 1045 |
| Minimum | 696 |
|
|
- Mean = 1324.51
- Std.dev = 234.044
- 2 items above graph maximum of 2233
|
Notes
Area of pericalcarine in the right hemisphere generated by parcellation of the pial surface using Desikan-Killiany parcellation
0 Related Data-Fields
There are no related data-fields
0 Resources
There are no matching Resources
