Data
87,996 items of data are available, covering 83,313 participants.
Defined-instances run from 2 to 3, labelled using Instancing
2.
Units of measurement are mm2.
| Maximum | 3384 |
| Decile 9 | 1943 |
| Decile 8 | 1835 |
| Decile 7 | 1763 |
| Decile 6 | 1703 |
| Median | 1650 |
| Decile 4 | 1600 |
| Decile 3 | 1547 |
| Decile 2 | 1488 |
| Decile 1 | 1411 |
| Minimum | 836 |
|

|
- Mean = 1667.17
- Std.dev = 211.901
- 1 item below graph minimum of 879
- 132 items above graph maximum of 2475
|
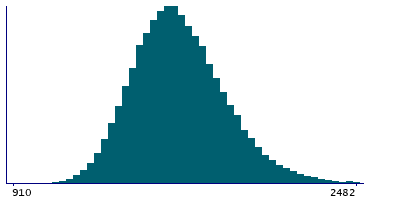
2 Instances
Instance 2 : Imaging visit (2014+)
83,241 participants, 83,241 items
| Maximum | 3384 |
| Decile 9 | 1943 |
| Decile 8 | 1835 |
| Decile 7 | 1763 |
| Decile 6 | 1703 |
| Median | 1650 |
| Decile 4 | 1599 |
| Decile 3 | 1547 |
| Decile 2 | 1488 |
| Decile 1 | 1411 |
| Minimum | 836 |
|
|
- Mean = 1666.73
- Std.dev = 211.889
- 1 item below graph minimum of 879
- 125 items above graph maximum of 2475
|
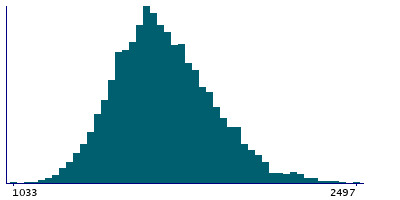
Instance 3 : First repeat imaging visit (2019+)
4,755 participants, 4,755 items
| Maximum | 2752 |
| Decile 9 | 1958 |
| Decile 8 | 1848 |
| Decile 7 | 1771 |
| Decile 6 | 1711 |
| Median | 1655 |
| Decile 4 | 1608 |
| Decile 3 | 1558 |
| Decile 2 | 1494 |
| Decile 1 | 1419 |
| Minimum | 1033 |
|
|
- Mean = 1674.94
- Std.dev = 211.949
- 5 items above graph maximum of 2497
|
Notes
Area of paracentral in the right hemisphere generated by parcellation of the pial surface using Desikan-Killiany parcellation
0 Related Data-Fields
There are no related data-fields
0 Resources
There are no matching Resources
