Data
87,996 items of data are available, covering 83,313 participants.
Defined-instances run from 2 to 3, labelled using Instancing
2.
Units of measurement are mm2.
| Maximum | 1606 |
| Decile 9 | 805 |
| Decile 8 | 743 |
| Decile 7 | 702 |
| Decile 6 | 669 |
| Median | 640 |
| Decile 4 | 613 |
| Decile 3 | 584 |
| Decile 2 | 552 |
| Decile 1 | 512 |
| Minimum | 108 |
|
|
- Mean = 651.866
- Std.dev = 119.31
- 282 items above graph maximum of 1098
|
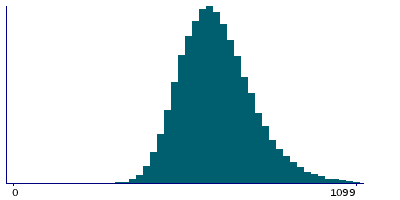
2 Instances
Instance 2 : Imaging visit (2014+)
83,241 participants, 83,241 items
| Maximum | 1606 |
| Decile 9 | 805 |
| Decile 8 | 743 |
| Decile 7 | 702 |
| Decile 6 | 669 |
| Median | 640 |
| Decile 4 | 613 |
| Decile 3 | 584 |
| Decile 2 | 552 |
| Decile 1 | 512 |
| Minimum | 108 |
|

|
- Mean = 651.89
- Std.dev = 119.251
- 267 items above graph maximum of 1098
|
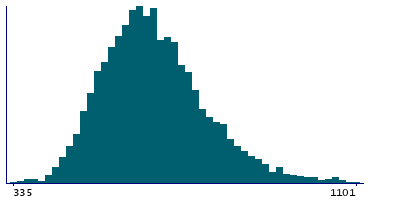
Instance 3 : First repeat imaging visit (2019+)
4,755 participants, 4,755 items
| Maximum | 1366 |
| Decile 9 | 807 |
| Decile 8 | 739 |
| Decile 7 | 699 |
| Decile 6 | 667 |
| Median | 638 |
| Decile 4 | 612 |
| Decile 3 | 584 |
| Decile 2 | 552 |
| Decile 1 | 513 |
| Minimum | 335 |
|
|
- Mean = 651.437
- Std.dev = 120.335
- 15 items above graph maximum of 1101
|
Notes
Area of entorhinal in the right hemisphere generated by parcellation of the pial surface using Desikan-Killiany parcellation
0 Related Data-Fields
There are no related data-fields
0 Resources
There are no matching Resources
