Data
87,996 items of data are available, covering 83,313 participants.
Defined-instances run from 2 to 3, labelled using Instancing
2.
Units of measurement are mm2.
| Maximum | 1153 |
| Decile 9 | 710 |
| Decile 8 | 654 |
| Decile 7 | 614 |
| Decile 6 | 582 |
| Median | 553 |
| Decile 4 | 524 |
| Decile 3 | 496 |
| Decile 2 | 466 |
| Decile 1 | 429 |
| Minimum | 217 |
|

|
- Mean = 562.478
- Std.dev = 109.735
- 60 items above graph maximum of 991
|
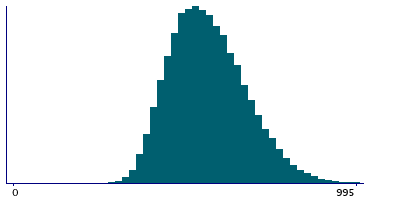
2 Instances
Instance 2 : Imaging visit (2014+)
83,241 participants, 83,241 items
| Maximum | 1133 |
| Decile 9 | 709 |
| Decile 8 | 653 |
| Decile 7 | 614 |
| Decile 6 | 581 |
| Median | 552 |
| Decile 4 | 524 |
| Decile 3 | 496 |
| Decile 2 | 466 |
| Decile 1 | 429 |
| Minimum | 217 |
|
|
- Mean = 562.137
- Std.dev = 109.531
- 55 items above graph maximum of 989
|
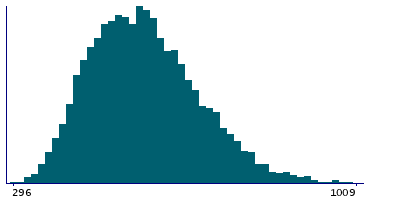
Instance 3 : First repeat imaging visit (2019+)
4,755 participants, 4,755 items
| Maximum | 1153 |
| Decile 9 | 720 |
| Decile 8 | 661 |
| Decile 7 | 621 |
| Decile 6 | 588 |
| Median | 559 |
| Decile 4 | 529 |
| Decile 3 | 500 |
| Decile 2 | 469 |
| Decile 1 | 431 |
| Minimum | 296 |
|
|
- Mean = 568.441
- Std.dev = 113.085
- 5 items above graph maximum of 1009
|
Notes
Area of transversetemporal in the left hemisphere generated by parcellation of the pial surface using Desikan-Killiany parcellation
0 Related Data-Fields
There are no related data-fields
0 Resources
There are no matching Resources
