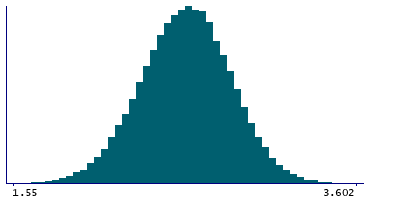
Data
87,996 items of data are available, covering 83,313 participants.
Defined-instances run from 2 to 3, labelled using Instancing
2.
Units of measurement are mm.
| Maximum | 4.014 |
| Decile 9 | 2.917 |
| Decile 8 | 2.804 |
| Decile 7 | 2.721 |
| Decile 6 | 2.65 |
| Median | 2.582 |
| Decile 4 | 2.514 |
| Decile 3 | 2.441 |
| Decile 2 | 2.354 |
| Decile 1 | 2.232 |
| Minimum | 1.072 |
|
|
- Mean = 2.57843
- Std.dev = 0.267408
- 9 items below graph minimum of 1.547
- 5 items above graph maximum of 3.602
|
2 Instances
Instance 2 : Imaging visit (2014+)
83,241 participants, 83,241 items
| Maximum | 4.014 |
| Decile 9 | 2.917 |
| Decile 8 | 2.804 |
| Decile 7 | 2.721 |
| Decile 6 | 2.65 |
| Median | 2.582 |
| Decile 4 | 2.513 |
| Decile 3 | 2.44 |
| Decile 2 | 2.353 |
| Decile 1 | 2.231 |
| Minimum | 1.072 |
|

|
- Mean = 2.57809
- Std.dev = 0.26763
- 9 items below graph minimum of 1.545
- 3 items above graph maximum of 3.603
|
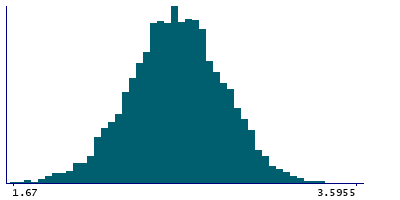
Instance 3 : First repeat imaging visit (2019+)
4,755 participants, 4,755 items
| Maximum | 3.724 |
| Decile 9 | 2.92 |
| Decile 8 | 2.807 |
| Decile 7 | 2.722 |
| Decile 6 | 2.655 |
| Median | 2.5845 |
| Decile 4 | 2.519 |
| Decile 3 | 2.452 |
| Decile 2 | 2.367 |
| Decile 1 | 2.2445 |
| Minimum | 1.67 |
|
|
- Mean = 2.5843
- Std.dev = 0.263429
- 2 items above graph maximum of 3.5955
|
Notes
Mean thickness of transversetemporal in the right hemisphere generated by parcellation of the white surface using Desikan-Killiany parcellation
0 Related Data-Fields
There are no related data-fields
0 Resources
There are no matching Resources
