Data
87,996 items of data are available, covering 83,313 participants.
Defined-instances run from 2 to 3, labelled using Instancing
2.
Units of measurement are mm2.
| Maximum | 2943 |
| Decile 9 | 1914 |
| Decile 8 | 1773 |
| Decile 7 | 1678 |
| Decile 6 | 1600 |
| Median | 1531 |
| Decile 4 | 1465 |
| Decile 3 | 1398 |
| Decile 2 | 1324 |
| Decile 1 | 1229 |
| Minimum | 562 |
|

|
- Mean = 1554.16
- Std.dev = 267.942
- 43 items above graph maximum of 2599
|
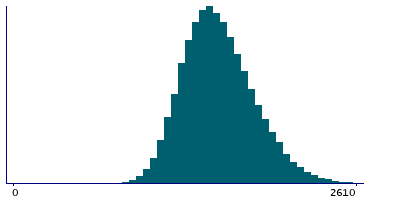
2 Instances
Instance 2 : Imaging visit (2014+)
83,241 participants, 83,241 items
| Maximum | 2943 |
| Decile 9 | 1914 |
| Decile 8 | 1773 |
| Decile 7 | 1677 |
| Decile 6 | 1600 |
| Median | 1530 |
| Decile 4 | 1464 |
| Decile 3 | 1398 |
| Decile 2 | 1324 |
| Decile 1 | 1229 |
| Minimum | 562 |
|
|
- Mean = 1553.58
- Std.dev = 268.062
- 41 items above graph maximum of 2599
|
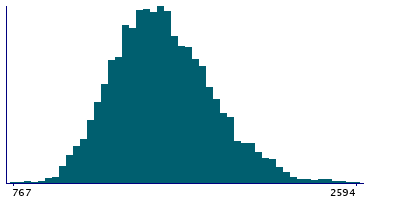
Instance 3 : First repeat imaging visit (2019+)
4,755 participants, 4,755 items
| Maximum | 2736 |
| Decile 9 | 1917.5 |
| Decile 8 | 1781 |
| Decile 7 | 1689 |
| Decile 6 | 1610 |
| Median | 1543 |
| Decile 4 | 1478 |
| Decile 3 | 1411 |
| Decile 2 | 1338 |
| Decile 1 | 1241 |
| Minimum | 767 |
|
|
- Mean = 1564.3
- Std.dev = 265.616
- 2 items above graph maximum of 2594
|
Notes
Area of pericalcarine in the right hemisphere generated by parcellation of the white surface using Desikan-Killiany parcellation
0 Related Data-Fields
There are no related data-fields
0 Resources
There are no matching Resources
