Data
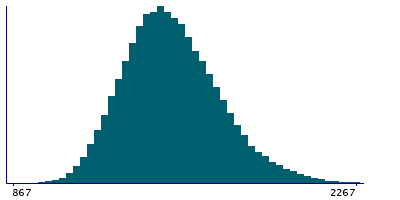
87,996 items of data are available, covering 83,313 participants.
Defined-instances run from 2 to 3, labelled using Instancing
2.
Units of measurement are mm2.
| Maximum | 3389 |
| Decile 9 | 1768 |
| Decile 8 | 1669 |
| Decile 7 | 1601 |
| Decile 6 | 1545 |
| Median | 1495 |
| Decile 4 | 1448 |
| Decile 3 | 1399 |
| Decile 2 | 1345 |
| Decile 1 | 1272 |
| Minimum | 867 |
|
|
- Mean = 1511.3
- Std.dev = 196.171
- 93 items above graph maximum of 2264
|
2 Instances
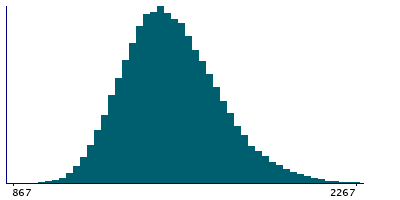
Instance 2 : Imaging visit (2014+)
83,241 participants, 83,241 items
| Maximum | 3389 |
| Decile 9 | 1767 |
| Decile 8 | 1669 |
| Decile 7 | 1600.5 |
| Decile 6 | 1545 |
| Median | 1495 |
| Decile 4 | 1448 |
| Decile 3 | 1399 |
| Decile 2 | 1345 |
| Decile 1 | 1272 |
| Minimum | 867 |
|
|
- Mean = 1510.8
- Std.dev = 196.183
- 89 items above graph maximum of 2262
|
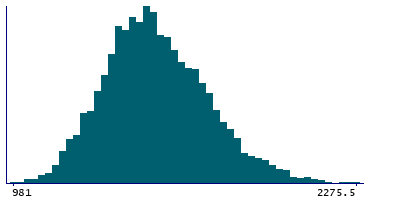
Instance 3 : First repeat imaging visit (2019+)
4,755 participants, 4,755 items
| Maximum | 2467 |
| Decile 9 | 1778 |
| Decile 8 | 1681 |
| Decile 7 | 1612.5 |
| Decile 6 | 1554 |
| Median | 1503 |
| Decile 4 | 1458 |
| Decile 3 | 1408 |
| Decile 2 | 1357 |
| Decile 1 | 1280.5 |
| Minimum | 981 |
|
|
- Mean = 1520.13
- Std.dev = 195.763
- 4 items above graph maximum of 2275.5
|
Notes
Area of paracentral in the right hemisphere generated by parcellation of the white surface using Desikan-Killiany parcellation
0 Related Data-Fields
There are no related data-fields
0 Resources
There are no matching Resources
