Data
87,996 items of data are available, covering 83,313 participants.
Defined-instances run from 2 to 3, labelled using Instancing
2.
Units of measurement are mm.
| Maximum | 3.391 |
| Decile 9 | 2.971 |
| Decile 8 | 2.913 |
| Decile 7 | 2.87 |
| Decile 6 | 2.832 |
| Median | 2.795 |
| Decile 4 | 2.758 |
| Decile 3 | 2.716 |
| Decile 2 | 2.665 |
| Decile 1 | 2.587 |
| Minimum | 1.853 |
|

|
- Mean = 2.7856
- Std.dev = 0.153009
- 89 items below graph minimum of 2.203
- 3 items above graph maximum of 3.355
|
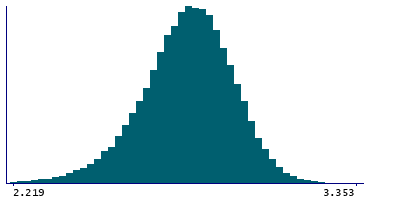
2 Instances
Instance 2 : Imaging visit (2014+)
83,241 participants, 83,241 items
| Maximum | 3.391 |
| Decile 9 | 2.97 |
| Decile 8 | 2.912 |
| Decile 7 | 2.869 |
| Decile 6 | 2.831 |
| Median | 2.795 |
| Decile 4 | 2.757 |
| Decile 3 | 2.715 |
| Decile 2 | 2.664 |
| Decile 1 | 2.585 |
| Minimum | 1.853 |
|
|
- Mean = 2.78447
- Std.dev = 0.153457
- 82 items below graph minimum of 2.2
- 3 items above graph maximum of 3.355
|
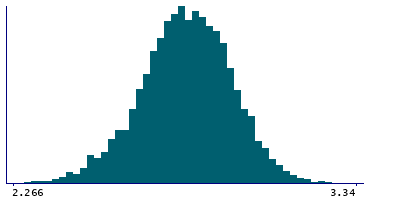
Instance 3 : First repeat imaging visit (2019+)
4,755 participants, 4,755 items
| Maximum | 3.343 |
| Decile 9 | 2.982 |
| Decile 8 | 2.924 |
| Decile 7 | 2.885 |
| Decile 6 | 2.846 |
| Median | 2.8095 |
| Decile 4 | 2.775 |
| Decile 3 | 2.737 |
| Decile 2 | 2.692 |
| Decile 1 | 2.624 |
| Minimum | 1.957 |
|
|
- Mean = 2.80542
- Std.dev = 0.143506
- 8 items below graph minimum of 2.266
- 1 item above graph maximum of 3.34
|
Notes
Mean thickness of supramarginal in the left hemisphere generated by parcellation of the white surface using Desikan-Killiany parcellation
0 Related Data-Fields
There are no related data-fields
Problem running reference query
0 Resources
There are no matching Resources
