Data
87,996 items of data are available, covering 83,313 participants.
Defined-instances run from 2 to 3, labelled using Instancing
2.
Units of measurement are mm.
| Maximum | 3.459 |
| Decile 9 | 3.015 |
| Decile 8 | 2.946 |
| Decile 7 | 2.893 |
| Decile 6 | 2.846 |
| Median | 2.8 |
| Decile 4 | 2.751 |
| Decile 3 | 2.694 |
| Decile 2 | 2.625 |
| Decile 1 | 2.522 |
| Minimum | 1.448 |
|

|
- Mean = 2.78126
- Std.dev = 0.195422
- 85 items below graph minimum of 2.029
|
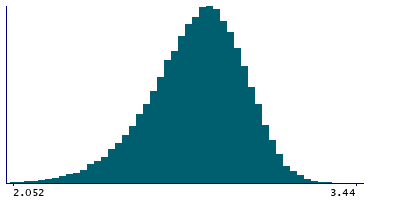
2 Instances
Instance 2 : Imaging visit (2014+)
83,241 participants, 83,241 items
| Maximum | 3.459 |
| Decile 9 | 3.014 |
| Decile 8 | 2.945 |
| Decile 7 | 2.892 |
| Decile 6 | 2.845 |
| Median | 2.799 |
| Decile 4 | 2.749 |
| Decile 3 | 2.693 |
| Decile 2 | 2.623 |
| Decile 1 | 2.52 |
| Minimum | 1.658 |
|
|
- Mean = 2.77976
- Std.dev = 0.195782
- 77 items below graph minimum of 2.026
|
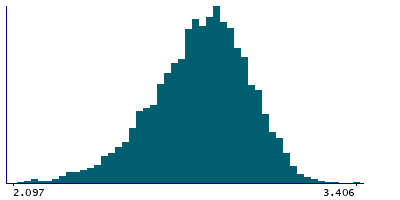
Instance 3 : First repeat imaging visit (2019+)
4,755 participants, 4,755 items
| Maximum | 3.406 |
| Decile 9 | 3.033 |
| Decile 8 | 2.965 |
| Decile 7 | 2.9135 |
| Decile 6 | 2.869 |
| Median | 2.824 |
| Decile 4 | 2.778 |
| Decile 3 | 2.725 |
| Decile 2 | 2.66 |
| Decile 1 | 2.565 |
| Minimum | 1.448 |
|
|
- Mean = 2.80751
- Std.dev = 0.187072
- 8 items below graph minimum of 2.097
|
Notes
Mean thickness of precentral in the left hemisphere generated by parcellation of the white surface using Desikan-Killiany parcellation
0 Related Data-Fields
There are no related data-fields
Problem running reference query
0 Resources
There are no matching Resources
