Data
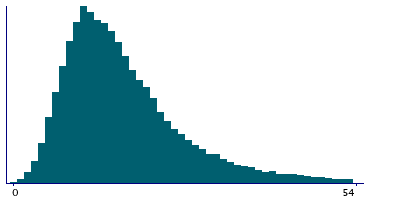
87,996 items of data are available, covering 83,313 participants.
Defined-instances run from 2 to 3, labelled using Instancing
2.
Units of measurement are count.
| Maximum | 326 |
| Decile 9 | 33 |
| Decile 8 | 25 |
| Decile 7 | 21 |
| Decile 6 | 18 |
| Median | 16 |
| Decile 4 | 14 |
| Decile 3 | 12 |
| Decile 2 | 10 |
| Decile 1 | 8 |
| Minimum | 0 |
|
|
- There are 156 distinct values.
- Mean = 18.7147
- Std.dev = 12.3916
- 1304 items above graph maximum of 58
|
2 Instances
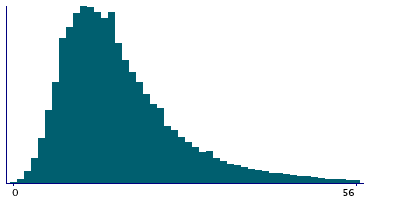
Instance 2 : Imaging visit (2014+)
83,241 participants, 83,241 items
| Maximum | 326 |
| Decile 9 | 33 |
| Decile 8 | 25 |
| Decile 7 | 21 |
| Decile 6 | 18 |
| Median | 16 |
| Decile 4 | 14 |
| Decile 3 | 12 |
| Decile 2 | 10 |
| Decile 1 | 8 |
| Minimum | 0 |
|
|
- There are 156 distinct values.
- Mean = 18.8186
- Std.dev = 12.5196
- 1270 items above graph maximum of 58
|
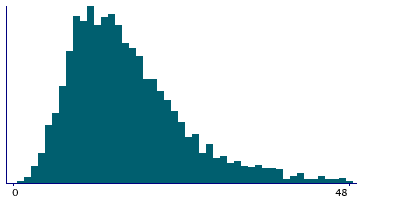
Instance 3 : First repeat imaging visit (2019+)
4,755 participants, 4,755 items
| Maximum | 86 |
| Decile 9 | 28 |
| Decile 8 | 22 |
| Decile 7 | 19 |
| Decile 6 | 17 |
| Median | 15 |
| Decile 4 | 13 |
| Decile 3 | 11 |
| Decile 2 | 10 |
| Decile 1 | 8 |
| Minimum | 1 |
|
|
- There are 76 distinct values.
- Mean = 16.8957
- Std.dev = 9.70581
- 70 items above graph maximum of 48
|
Notes
Number of HolesBeforeFixing in the right hemisphere generated by subcortical volumetric segmentation (aseg)
0 Related Data-Fields
There are no related data-fields
0 Resources
There are no matching Resources
