Data
87,996 items of data are available, covering 83,313 participants.
Defined-instances run from 2 to 3, labelled using Instancing
2.
Units of measurement are mm3.
| Maximum | 3181.7 |
| Decile 9 | 2007 |
| Decile 8 | 1896.45 |
| Decile 7 | 1819.6 |
| Decile 6 | 1756.6 |
| Median | 1698.8 |
| Decile 4 | 1643.8 |
| Decile 3 | 1586.6 |
| Decile 2 | 1520.85 |
| Decile 1 | 1431.15 |
| Minimum | 404.1 |
|

|
- Mean = 1710.22
- Std.dev = 229.551
- 19 items below graph minimum of 855.3
- 45 items above graph maximum of 2582.85
|
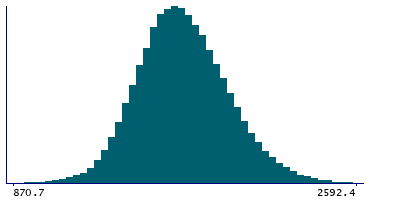
2 Instances
Instance 2 : Imaging visit (2014+)
83,241 participants, 83,241 items
| Maximum | 3181.7 |
| Decile 9 | 2005.8 |
| Decile 8 | 1895.5 |
| Decile 7 | 1818.3 |
| Decile 6 | 1754.95 |
| Median | 1697.5 |
| Decile 4 | 1642.2 |
| Decile 3 | 1585.1 |
| Decile 2 | 1519.1 |
| Decile 1 | 1429.5 |
| Minimum | 404.1 |
|
|
- Mean = 1708.82
- Std.dev = 229.736
- 17 items below graph minimum of 853.2
- 44 items above graph maximum of 2582.1
|
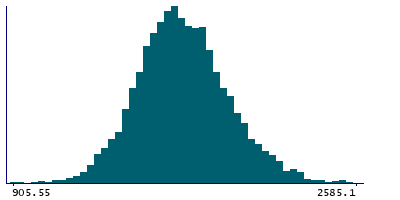
Instance 3 : First repeat imaging visit (2019+)
4,755 participants, 4,755 items
| Maximum | 2643.7 |
| Decile 9 | 2025.25 |
| Decile 8 | 1914.5 |
| Decile 7 | 1840.85 |
| Decile 6 | 1782.6 |
| Median | 1723.25 |
| Decile 4 | 1672 |
| Decile 3 | 1613.8 |
| Decile 2 | 1551.1 |
| Decile 1 | 1465.4 |
| Minimum | 788.1 |
|
|
- Mean = 1734.82
- Std.dev = 224.87
- 3 items below graph minimum of 905.55
- 1 item above graph maximum of 2585.1
|
Notes
Volume of Amygdala in the right hemisphere generated by subcortical volumetric segmentation (aseg)
0 Related Data-Fields
There are no related data-fields
0 Resources
There are no matching Resources
