Data
87,996 items of data are available, covering 83,313 participants.
Defined-instances run from 2 to 3, labelled using Instancing
2.
Units of measurement are mm3.
| Maximum | 4358.6 |
| Decile 9 | 2266.9 |
| Decile 8 | 2154.2 |
| Decile 7 | 2076.8 |
| Decile 6 | 2013.3 |
| Median | 1955.4 |
| Decile 4 | 1898.8 |
| Decile 3 | 1838.8 |
| Decile 2 | 1771 |
| Decile 1 | 1681.5 |
| Minimum | 517.1 |
|
|
- Mean = 1966.4
- Std.dev = 231.711
- 8 items below graph minimum of 1096.1
- 65 items above graph maximum of 2852.3
|
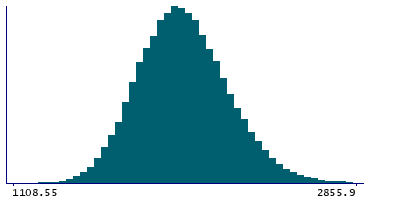
2 Instances
Instance 2 : Imaging visit (2014+)
83,241 participants, 83,241 items
| Maximum | 4358.6 |
| Decile 9 | 2266.35 |
| Decile 8 | 2153.8 |
| Decile 7 | 2076.3 |
| Decile 6 | 2012.8 |
| Median | 1954.8 |
| Decile 4 | 1898.2 |
| Decile 3 | 1838 |
| Decile 2 | 1770.2 |
| Decile 1 | 1680.1 |
| Minimum | 517.1 |
|

|
- Mean = 1965.67
- Std.dev = 231.883
- 8 items below graph minimum of 1093.85
- 62 items above graph maximum of 2852.6
|
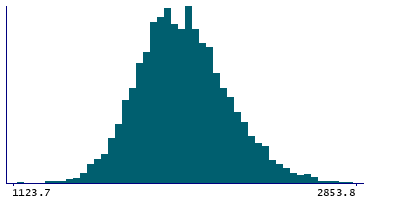
Instance 3 : First repeat imaging visit (2019+)
4,755 participants, 4,755 items
| Maximum | 3341.5 |
| Decile 9 | 2276.15 |
| Decile 8 | 2163.9 |
| Decile 7 | 2086.2 |
| Decile 6 | 2022.8 |
| Median | 1966.15 |
| Decile 4 | 1907.7 |
| Decile 3 | 1852.05 |
| Decile 2 | 1787.5 |
| Decile 1 | 1700.4 |
| Minimum | 1114.1 |
|
|
- Mean = 1979.1
- Std.dev = 228.303
- 1 item below graph minimum of 1124.65
- 3 items above graph maximum of 2851.9
|
Notes
Volume of Pallidum in the right hemisphere generated by subcortical volumetric segmentation (aseg)
0 Related Data-Fields
There are no related data-fields
0 Resources
There are no matching Resources
