Data
87,996 items of data are available, covering 83,313 participants.
Defined-instances run from 2 to 3, labelled using Instancing
2.
Units of measurement are mm3.
| Maximum | 11812.1 |
| Decile 9 | 5250.45 |
| Decile 8 | 4987 |
| Decile 7 | 4802.9 |
| Decile 6 | 4651.5 |
| Median | 4515.7 |
| Decile 4 | 4381.3 |
| Decile 3 | 4241.6 |
| Decile 2 | 4082.1 |
| Decile 1 | 3869.6 |
| Minimum | 1872.6 |
|

|
- Mean = 4542.58
- Std.dev = 553.647
- 22 items below graph minimum of 2488.75
- 118 items above graph maximum of 6631.3
|
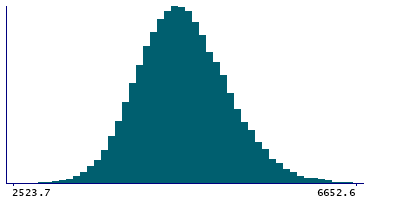
2 Instances
Instance 2 : Imaging visit (2014+)
83,241 participants, 83,241 items
| Maximum | 11812.1 |
| Decile 9 | 5248.65 |
| Decile 8 | 4985.15 |
| Decile 7 | 4800.5 |
| Decile 6 | 4649.2 |
| Median | 4514.15 |
| Decile 4 | 4379.4 |
| Decile 3 | 4239.8 |
| Decile 2 | 4080.5 |
| Decile 1 | 3866.8 |
| Minimum | 1872.6 |
|
|
- Mean = 4540.8
- Std.dev = 554.172
- 20 items below graph minimum of 2484.95
- 116 items above graph maximum of 6630.5
|
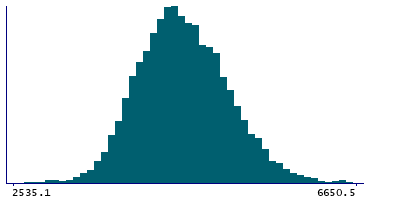
Instance 3 : First repeat imaging visit (2019+)
4,755 participants, 4,755 items
| Maximum | 7795.8 |
| Decile 9 | 5278.7 |
| Decile 8 | 5021.9 |
| Decile 7 | 4844.7 |
| Decile 6 | 4686.3 |
| Median | 4541.5 |
| Decile 4 | 4411.1 |
| Decile 3 | 4273.2 |
| Decile 2 | 4117 |
| Decile 1 | 3906.9 |
| Minimum | 2146.5 |
|
|
- Mean = 4573.68
- Std.dev = 543.426
- 2 items below graph minimum of 2535.1
- 3 items above graph maximum of 6650.5
|
Notes
Volume of Putamen in the right hemisphere generated by subcortical volumetric segmentation (aseg)
0 Related Data-Fields
There are no related data-fields
0 Resources
There are no matching Resources
