Data
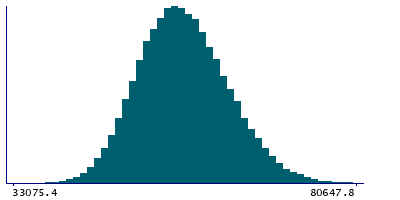
87,996 items of data are available, covering 83,313 participants.
Defined-instances run from 2 to 3, labelled using Instancing
2.
Units of measurement are mm3.
| Maximum | 107156 |
| Decile 9 | 64538.6 |
| Decile 8 | 61548.7 |
| Decile 7 | 59445.5 |
| Decile 6 | 57707.9 |
| Median | 56090.9 |
| Decile 4 | 54536.9 |
| Decile 3 | 52915.9 |
| Decile 2 | 51104.3 |
| Decile 1 | 48697.7 |
| Minimum | 15940.8 |
|

|
- Mean = 56394.6
- Std.dev = 6212.43
- 10 items below graph minimum of 32856.7
- 33 items above graph maximum of 80379.5
|
2 Instances
Instance 2 : Imaging visit (2014+)
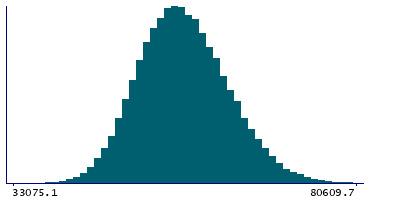
83,241 participants, 83,241 items
| Maximum | 107156 |
| Decile 9 | 64503.8 |
| Decile 8 | 61512.9 |
| Decile 7 | 59411.3 |
| Decile 6 | 57677.2 |
| Median | 56059.4 |
| Decile 4 | 54507 |
| Decile 3 | 52882.4 |
| Decile 2 | 51078.2 |
| Decile 1 | 48675.3 |
| Minimum | 15940.8 |
|

|
- Mean = 56364.3
- Std.dev = 6210.36
- 8 items below graph minimum of 32846.8
- 31 items above graph maximum of 80332.3
|
Instance 3 : First repeat imaging visit (2019+)
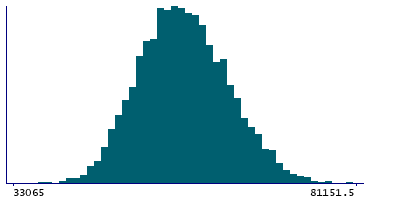
4,755 participants, 4,755 items
| Maximum | 82245.9 |
| Decile 9 | 65122.7 |
| Decile 8 | 62288.2 |
| Decile 7 | 60093 |
| Decile 6 | 58329.3 |
| Median | 56680.4 |
| Decile 4 | 55104.9 |
| Decile 3 | 53456.1 |
| Decile 2 | 51594.6 |
| Decile 1 | 49093.9 |
| Minimum | 24318.9 |
|

|
- Mean = 56924.5
- Std.dev = 6224.64
- 2 items below graph minimum of 33065
- 2 items above graph maximum of 81151.5
|
Notes
Volume of Cerebellum-Cortex in the right hemisphere generated by subcortical volumetric segmentation (aseg)
0 Related Data-Fields
There are no related data-fields
0 Resources
There are no matching Resources


