Data
87,996 items of data are available, covering 83,313 participants.
Defined-instances run from 2 to 3, labelled using Instancing
2.
Units of measurement are AU.
| Maximum | 75.7483 |
| Decile 9 | 64.7596 |
| Decile 8 | 63.7862 |
| Decile 7 | 63.1351 |
| Decile 6 | 62.5934 |
| Median | 62.0896 |
| Decile 4 | 61.5827 |
| Decile 3 | 61.0152 |
| Decile 2 | 60.3535 |
| Decile 1 | 59.4618 |
| Minimum | 48.5509 |
|
|
- Mean = 62.1089
- Std.dev = 2.14837
- 32 items below graph minimum of 54.1639
- 118 items above graph maximum of 70.0575
|
2 Instances
Instance 2 : Imaging visit (2014+)
83,241 participants, 83,241 items
| Maximum | 75.7483 |
| Decile 9 | 64.799 |
| Decile 8 | 63.812 |
| Decile 7 | 63.1666 |
| Decile 6 | 62.617 |
| Median | 62.115 |
| Decile 4 | 61.6038 |
| Decile 3 | 61.034 |
| Decile 2 | 60.3746 |
| Decile 1 | 59.4804 |
| Minimum | 48.5509 |
|

|
- Mean = 62.1345
- Std.dev = 2.15423
- 30 items below graph minimum of 54.1617
- 110 items above graph maximum of 70.1177
|
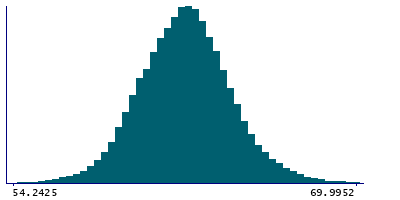
Instance 3 : First repeat imaging visit (2019+)
4,755 participants, 4,755 items
| Maximum | 72.5538 |
| Decile 9 | 64.0728 |
| Decile 8 | 63.2203 |
| Decile 7 | 62.659 |
| Decile 6 | 62.1867 |
| Median | 61.7233 |
| Decile 4 | 61.198 |
| Decile 3 | 60.6527 |
| Decile 2 | 60.0476 |
| Decile 1 | 59.1687 |
| Minimum | 51.352 |
|

|
- Mean = 61.6613
- Std.dev = 1.99064
- 2 items below graph minimum of 54.2646
- 6 items above graph maximum of 68.9769
|
Notes
Mean intensity of Cerebellum-Cortex in the right hemisphere generated by subcortical volumetric segmentation (aseg)
0 Related Data-Fields
There are no related data-fields
0 Resources
There are no matching Resources
