Data
87,996 items of data are available, covering 83,313 participants.
Defined-instances run from 2 to 3, labelled using Instancing
2.
Units of measurement are ratio.
| Maximum | 1.83984 |
| Decile 9 | 0.81498 |
| Decile 8 | 0.800933 |
| Decile 7 | 0.791276 |
| Decile 6 | 0.783176 |
| Median | 0.775739 |
| Decile 4 | 0.768072 |
| Decile 3 | 0.759799 |
| Decile 2 | 0.750145 |
| Decile 1 | 0.736306 |
| Minimum | 0.210131 |
|

|
- Mean = 0.775693
- Std.dev = 0.0332908
- 132 items below graph minimum of 0.657631
- 88 items above graph maximum of 0.893655
|
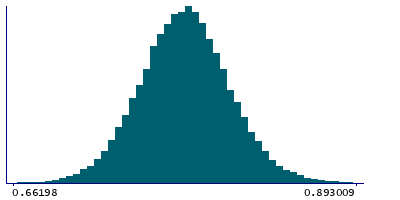
2 Instances
Instance 2 : Imaging visit (2014+)
83,241 participants, 83,241 items
| Maximum | 1.83984 |
| Decile 9 | 0.814884 |
| Decile 8 | 0.800833 |
| Decile 7 | 0.791094 |
| Decile 6 | 0.782973 |
| Median | 0.775519 |
| Decile 4 | 0.767884 |
| Decile 3 | 0.759589 |
| Decile 2 | 0.749899 |
| Decile 1 | 0.73599 |
| Minimum | 0.210131 |
|
|
- Mean = 0.775502
- Std.dev = 0.033427
- 123 items below graph minimum of 0.657095
- 87 items above graph maximum of 0.893778
|
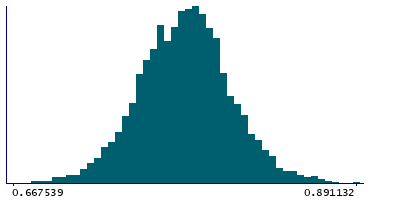
Instance 3 : First repeat imaging visit (2019+)
4,755 participants, 4,755 items
| Maximum | 0.938299 |
| Decile 9 | 0.816596 |
| Decile 8 | 0.802537 |
| Decile 7 | 0.794035 |
| Decile 6 | 0.786685 |
| Median | 0.779533 |
| Decile 4 | 0.772186 |
| Decile 3 | 0.7636 |
| Decile 2 | 0.754722 |
| Decile 1 | 0.74207 |
| Minimum | 0.459383 |
|
|
- Mean = 0.779044
- Std.dev = 0.0306156
- 8 items below graph minimum of 0.667544
- 3 items above graph maximum of 0.891122
|
Notes
Volume-ratio of BrainSegVol-to-eTIV in the whole brain generated by subcortical volumetric segmentation (aseg)
0 Related Data-Fields
There are no related data-fields
0 Resources
There are no matching Resources
