WARNING: the interactive features of this website use CSS3, which your browser does not support. To use the full features of this website, please update your browser.
Data
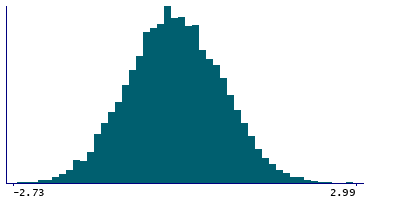
432,215 items of data are available, covering 432,215 participants.
Maximum
3.81
Decile 9
0.97
Decile 8
0.63
Decile 7
0.37
Decile 6
0.16
Median
-0.05
Decile 4
-0.24
Decile 3
-0.46
Decile 2
-0.7
Decile 1
-1.05
Minimum
-2.73
Mean = -0.0377205
Std.dev = 0.781504
180 items above graph maximum of 2.99
Notes
This domain measures the rate of recorded crime in an area for four major crime types representing the risk of personal and material victimisation at a small area level.
Violence - number of reported violent crimes (19 reported crime types) per 1000 at risk population
Burglary - number of reported burglaries (4 reported crime types) per 1000 at risk population
Theft - number of reported thefts (5 reported crime types) per 1000 at risk population
Criminal damage - number of reported crimes (11 reported crime types) per 1000 at risk population.