Data
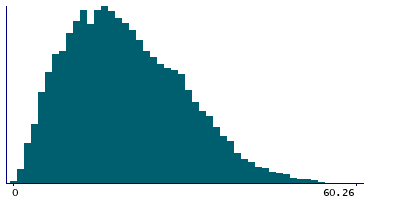
432,215 items of data are available, covering 432,215 participants.
| Maximum | 70.14 |
| Decile 9 | 33.77 |
| Decile 8 | 28.71 |
| Decile 7 | 24.83 |
| Decile 6 | 21.47 |
| Median | 18.61 |
| Decile 4 | 15.92 |
| Decile 3 | 13.23 |
| Decile 2 | 10.52 |
| Decile 1 | 7.28 |
| Minimum | 0.34 |
|

|
- Mean = 19.7769
- Std.dev = 10.1193
- 21 items above graph maximum of 60.26
|
Notes
This domain measures the physical and financial accessibility of housing and key local services. The indicators fall into two sub-domains: 'geographical barriers', which relate to the physical proximity of local services, and 'wider barriers' which includes issues relating to access to housing such as affordability. Seven indicators are combined to calculate this domain:
- Household overcrowding - the proportion of households within an LSOA which are judged to have insufficient space to meet the household's needs
- Homelessness - the rate of acceptances for housing assistance under the homelessness provisions of the 1996 Housing Act (at local authority district level)
- Difficulty of access to owner-occupation (local authority district level) - proportion of households aged under 35 whose income means they are unable to afford to enter owner occupation
- Road distance to a GP surgery
- Road distance to a supermarket or convenience store
- Road distance to a primary school
- Road distance to a Post Office.
0 Related Data-Fields
There are no related data-fields


