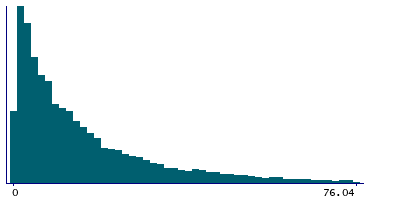
Data
432,215 items of data are available, covering 432,215 participants.
| Maximum | 98.09 |
| Decile 9 | 38.81 |
| Decile 8 | 25.54 |
| Decile 7 | 18.14 |
| Decile 6 | 13.56 |
| Median | 10.04 |
| Decile 4 | 7.18 |
| Decile 3 | 4.85 |
| Decile 2 | 3.03 |
| Decile 1 | 1.58 |
| Minimum | 0.02 |
|

|
- Mean = 15.5672
- Std.dev = 16.1685
- 3014 items above graph maximum of 76.04
|
Notes
This domain measures the extent of deprivation in terms of education, skills and training in an area. The indicators are structured into two sub-domains: one relating to children and young people and one relating to adult skills. These two sub-domains are designed to reflect the 'flow' and 'stock' of educational disadvantage within an area respectively. Seven indicators are used to calculate this domain:
- Average points score of pupils taking English, Maths and Science Key Stage 2 exams
- Average points score of pupils taking English, Maths and Science Key Stage 3 exams
- Average capped points score of pupils taking Key Stage 4 (GCSE or equivalent) exams
- Proportion of young people not staying on in school or non-advanced education above age 16
- Secondary school absence rate - the proportion of authorised and unauthorised absences from secondary school
- Proportion of those aged under 21 not entering Higher Education.
- Proportion of adults aged 25-54 with no or low qualifications.
0 Related Data-Fields
There are no related data-fields


