Data
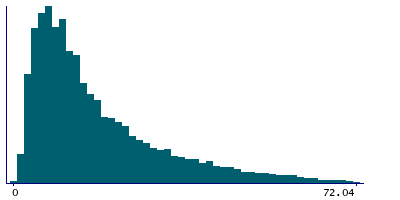
432,215 items of data are available, covering 432,215 participants.
| Maximum | 82 |
| Decile 9 | 38.3 |
| Decile 8 | 27.27 |
| Decile 7 | 20.86 |
| Decile 6 | 16.3 |
| Median | 13.1 |
| Decile 4 | 10.57 |
| Decile 3 | 8.51 |
| Decile 2 | 6.61 |
| Decile 1 | 4.56 |
| Minimum | 0.61 |
|

|
- Mean = 17.6842
- Std.dev = 14.014
- 1116 items above graph maximum of 72.04
|
Notes
The English Indices of Deprivation 2010 are measures of multiple deprivation at the small area level. The model of multiple deprivation which underpins the Indices of Deprivation 2010 is based on the idea of distinct domains of deprivation which can be recognised and measured separately. These domains are experienced by individuals living in an area. People may be counted in one or more of the domains, depending on the number of types of deprivation that they experience.
Each domain represents a specific form of deprivation experienced by people and each can be measured individually using a number of indicators. Seven distinct domains have been identified in the English Indices of Deprivation; Income Deprivation, Employment Deprivation, Health Deprivation and Disability, Education Skills and Training Deprivation, Barriers to Housing and Services, Living Environment Deprivation, and Crime. Individual domains can be used in isolation as measures of each specific form of deprivation. They can also be combined, using appropriate weights, into a single overall Index of Multiple Deprivation which can be used to rank every small area in England according to the deprivation experienced by the people living there. Along with two supplementary indices, Income Deprivation Affecting Children Index and Income Deprivation Affecting Older People Index, they form the English Indices of Deprivation. These statistics allow the most, and least, deprived areas of the country to be identified as well as providing information about the issues faced by people living in different parts of the country.


