Data
457,927 items of data are available, covering 210,739 participants.
Defined-instances run from 0 to 4, labelled using Instancing
1.
Units of measurement are g.
| Maximum | 573 |
| Decile 9 | 60 |
| Decile 8 | 60 |
| Decile 7 | 24 |
| Decile 6 | 0 |
| Median | 0 |
| Decile 4 | 0 |
| Decile 3 | 0 |
| Decile 2 | 0 |
| Decile 1 | 0 |
| Minimum | 0 |
|

|
- Mean = 20.9462
- Std.dev = 36.6076
- 11718 items above graph maximum of 120
|
5 Instances
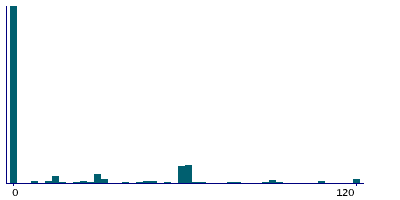
Instance 0 : Conducted in assessment centre, April 2009 to September 2010.
70,630 participants, 70,630 items
| Maximum | 495 |
| Decile 9 | 60 |
| Decile 8 | 60 |
| Decile 7 | 22.5 |
| Decile 6 | 0 |
| Median | 0 |
| Decile 4 | 0 |
| Decile 3 | 0 |
| Decile 2 | 0 |
| Decile 1 | 0 |
| Minimum | 0 |
|
|
- Mean = 21.0041
- Std.dev = 37.152
- 1797 items above graph maximum of 120
|
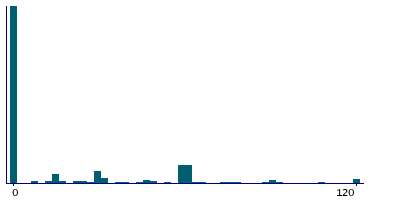
Instance 1 : On-line cycle 1, February 2011 to April 2011.
100,447 participants, 100,447 items
| Maximum | 454 |
| Decile 9 | 60 |
| Decile 8 | 60 |
| Decile 7 | 30 |
| Decile 6 | 0 |
| Median | 0 |
| Decile 4 | 0 |
| Decile 3 | 0 |
| Decile 2 | 0 |
| Decile 1 | 0 |
| Minimum | 0 |
|
|
- Mean = 22.8396
- Std.dev = 38.5685
- 3227 items above graph maximum of 120
|
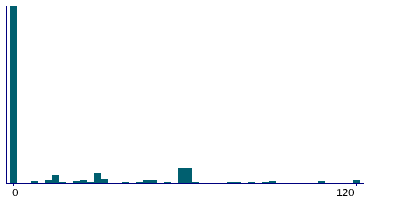
Instance 2 : On-line cycle 2, June 2011 to September 2011.
83,140 participants, 83,140 items
| Maximum | 448 |
| Decile 9 | 60 |
| Decile 8 | 46.25 |
| Decile 7 | 15 |
| Decile 6 | 0 |
| Median | 0 |
| Decile 4 | 0 |
| Decile 3 | 0 |
| Decile 2 | 0 |
| Decile 1 | 0 |
| Minimum | 0 |
|
|
- Mean = 18.471
- Std.dev = 33.3229
- 1379 items above graph maximum of 120
|
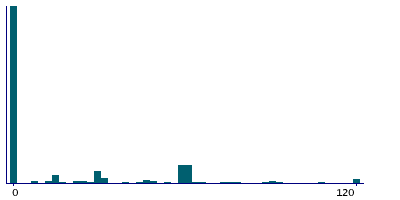
Instance 3 : On-line cycle 3, October 2011 to December 2011.
103,616 participants, 103,616 items
| Maximum | 555 |
| Decile 9 | 60 |
| Decile 8 | 60 |
| Decile 7 | 30 |
| Decile 6 | 0 |
| Median | 0 |
| Decile 4 | 0 |
| Decile 3 | 0 |
| Decile 2 | 0 |
| Decile 1 | 0 |
| Minimum | 0 |
|
|
- Mean = 22.5606
- Std.dev = 38.4107
- 3228 items above graph maximum of 120
|
Instance 4 : On-line cycle 4, April 2012 to June 2012.
100,094 participants, 100,094 items
| Maximum | 573 |
| Decile 9 | 60 |
| Decile 8 | 48 |
| Decile 7 | 15 |
| Decile 6 | 0 |
| Median | 0 |
| Decile 4 | 0 |
| Decile 3 | 0 |
| Decile 2 | 0 |
| Decile 1 | 0 |
| Minimum | 0 |
|

|
- Mean = 19.3899
- Std.dev = 34.6525
- 2087 items above graph maximum of 120
|
