Data
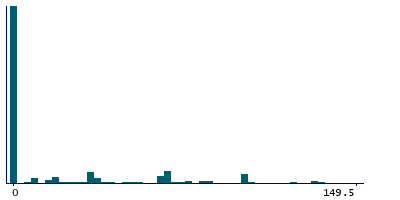
457,927 items of data are available, covering 210,739 participants.
Defined-instances run from 0 to 4, labelled using Instancing
1.
Units of measurement are g.
| Maximum | 363 |
| Decile 9 | 74.75 |
| Decile 8 | 35 |
| Decile 7 | 16.5 |
| Decile 6 | 0 |
| Median | 0 |
| Decile 4 | 0 |
| Decile 3 | 0 |
| Decile 2 | 0 |
| Decile 1 | 0 |
| Minimum | 0 |
|
|
- Mean = 20.652
- Std.dev = 38.3317
- 5939 items above graph maximum of 149.5
|
5 Instances
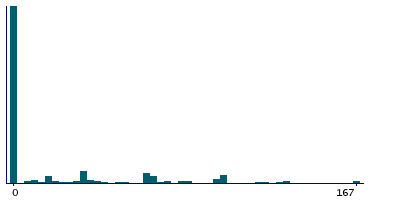
Instance 0 : Conducted in assessment centre, April 2009 to September 2010.
70,630 participants, 70,630 items
| Maximum | 363 |
| Decile 9 | 83.5 |
| Decile 8 | 35 |
| Decile 7 | 16.5 |
| Decile 6 | 0 |
| Median | 0 |
| Decile 4 | 0 |
| Decile 3 | 0 |
| Decile 2 | 0 |
| Decile 1 | 0 |
| Minimum | 0 |
|
|
- Mean = 21.5862
- Std.dev = 40.8044
- 753 items above graph maximum of 167
|
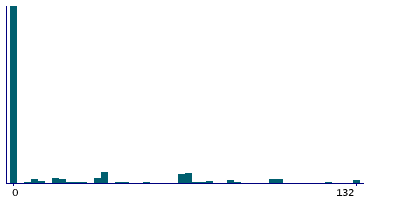
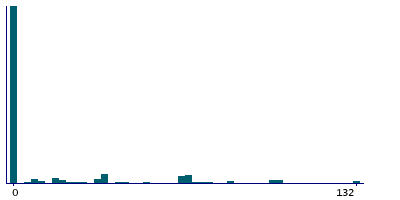
Instance 1 : On-line cycle 1, February 2011 to April 2011.
100,447 participants, 100,447 items
| Maximum | 363 |
| Decile 9 | 66 |
| Decile 8 | 35 |
| Decile 7 | 8.75 |
| Decile 6 | 0 |
| Median | 0 |
| Decile 4 | 0 |
| Decile 3 | 0 |
| Decile 2 | 0 |
| Decile 1 | 0 |
| Minimum | 0 |
|
|
- Mean = 19.5285
- Std.dev = 37.2533
- 1484 items above graph maximum of 132
|
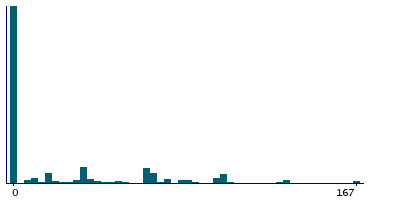
Instance 2 : On-line cycle 2, June 2011 to September 2011.
83,140 participants, 83,140 items
| Maximum | 363 |
| Decile 9 | 83.5 |
| Decile 8 | 66 |
| Decile 7 | 33 |
| Decile 6 | 0 |
| Median | 0 |
| Decile 4 | 0 |
| Decile 3 | 0 |
| Decile 2 | 0 |
| Decile 1 | 0 |
| Minimum | 0 |
|
|
- Mean = 25.3618
- Std.dev = 41.5114
- 801 items above graph maximum of 167
|
Instance 3 : On-line cycle 3, October 2011 to December 2011.
103,616 participants, 103,616 items
| Maximum | 363 |
| Decile 9 | 66 |
| Decile 8 | 33 |
| Decile 7 | 0 |
| Decile 6 | 0 |
| Median | 0 |
| Decile 4 | 0 |
| Decile 3 | 0 |
| Decile 2 | 0 |
| Decile 1 | 0 |
| Minimum | 0 |
|
|
- Mean = 15.2371
- Std.dev = 32.5466
- 961 items above graph maximum of 132
|
Instance 4 : On-line cycle 4, April 2012 to June 2012.
100,094 participants, 100,094 items
| Maximum | 363 |
| Decile 9 | 74.75 |
| Decile 8 | 55 |
| Decile 7 | 20 |
| Decile 6 | 0 |
| Median | 0 |
| Decile 4 | 0 |
| Decile 3 | 0 |
| Decile 2 | 0 |
| Decile 1 | 0 |
| Minimum | 0 |
|

|
- Mean = 22.8137
- Std.dev = 39.6395
- 1419 items above graph maximum of 149.5
|
