Data
457,927 items of data are available, covering 210,739 participants.
Defined-instances run from 0 to 4, labelled using Instancing
1.
Units of measurement are g.
| Maximum | 442 |
| Decile 9 | 69 |
| Decile 8 | 30 |
| Decile 7 | 11.5 |
| Decile 6 | 0 |
| Median | 0 |
| Decile 4 | 0 |
| Decile 3 | 0 |
| Decile 2 | 0 |
| Decile 1 | 0 |
| Minimum | 0 |
|

|
- Mean = 18.1832
- Std.dev = 36.9758
- 7644 items above graph maximum of 138
|
5 Instances
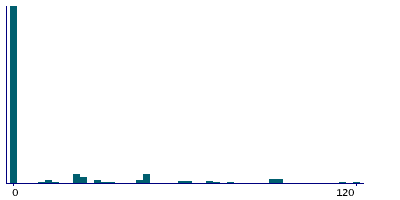
Instance 0 : Conducted in assessment centre, April 2009 to September 2010.
70,630 participants, 70,630 items
| Maximum | 422 |
| Decile 9 | 60 |
| Decile 8 | 23 |
| Decile 7 | 0 |
| Decile 6 | 0 |
| Median | 0 |
| Decile 4 | 0 |
| Decile 3 | 0 |
| Decile 2 | 0 |
| Decile 1 | 0 |
| Minimum | 0 |
|
|
- Mean = 15.9151
- Std.dev = 34.8095
- 1823 items above graph maximum of 120
|
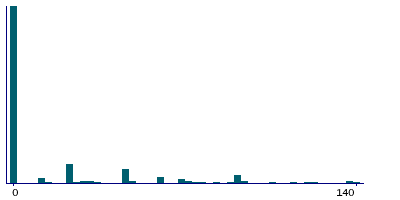
Instance 1 : On-line cycle 1, February 2011 to April 2011.
100,447 participants, 100,447 items
| Maximum | 419 |
| Decile 9 | 70 |
| Decile 8 | 30 |
| Decile 7 | 11.5 |
| Decile 6 | 0 |
| Median | 0 |
| Decile 4 | 0 |
| Decile 3 | 0 |
| Decile 2 | 0 |
| Decile 1 | 0 |
| Minimum | 0 |
|

|
- Mean = 18.4827
- Std.dev = 37.351
- 1620 items above graph maximum of 140
|
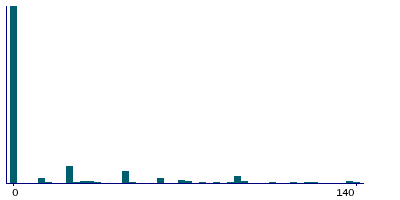
Instance 2 : On-line cycle 2, June 2011 to September 2011.
83,140 participants, 83,140 items
| Maximum | 440 |
| Decile 9 | 70 |
| Decile 8 | 38 |
| Decile 7 | 15 |
| Decile 6 | 0 |
| Median | 0 |
| Decile 4 | 0 |
| Decile 3 | 0 |
| Decile 2 | 0 |
| Decile 1 | 0 |
| Minimum | 0 |
|
|
- Mean = 19.3129
- Std.dev = 37.5882
- 1354 items above graph maximum of 140
|
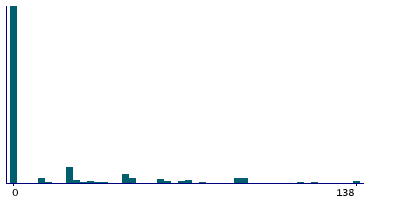
Instance 3 : On-line cycle 3, October 2011 to December 2011.
103,616 participants, 103,616 items
| Maximum | 418 |
| Decile 9 | 70 |
| Decile 8 | 30 |
| Decile 7 | 11.5 |
| Decile 6 | 0 |
| Median | 0 |
| Decile 4 | 0 |
| Decile 3 | 0 |
| Decile 2 | 0 |
| Decile 1 | 0 |
| Minimum | 0 |
|
|
- Mean = 18.5144
- Std.dev = 37.6197
- 1744 items above graph maximum of 140
|
Instance 4 : On-line cycle 4, April 2012 to June 2012.
100,094 participants, 100,094 items
| Maximum | 442 |
| Decile 9 | 69 |
| Decile 8 | 30 |
| Decile 7 | 11.5 |
| Decile 6 | 0 |
| Median | 0 |
| Decile 4 | 0 |
| Decile 3 | 0 |
| Decile 2 | 0 |
| Decile 1 | 0 |
| Minimum | 0 |
|
|
- Mean = 18.2021
- Std.dev = 36.8296
- 1666 items above graph maximum of 138
|
