Data
457,927 items of data are available, covering 210,739 participants.
Defined-instances run from 0 to 4, labelled using Instancing
1.
Units of measurement are g.
| Maximum | 1320 |
| Decile 9 | 90 |
| Decile 8 | 80 |
| Decile 7 | 0 |
| Decile 6 | 0 |
| Median | 0 |
| Decile 4 | 0 |
| Decile 3 | 0 |
| Decile 2 | 0 |
| Decile 1 | 0 |
| Minimum | 0 |
|
|
- Mean = 29.1967
- Std.dev = 56.7314
- 7133 items above graph maximum of 180
|
5 Instances
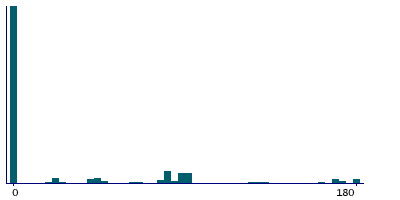
Instance 0 : Conducted in assessment centre, April 2009 to September 2010.
70,630 participants, 70,630 items
| Maximum | 960 |
| Decile 9 | 90 |
| Decile 8 | 80 |
| Decile 7 | 0 |
| Decile 6 | 0 |
| Median | 0 |
| Decile 4 | 0 |
| Decile 3 | 0 |
| Decile 2 | 0 |
| Decile 1 | 0 |
| Minimum | 0 |
|

|
- Mean = 28.752
- Std.dev = 58.3252
- 1237 items above graph maximum of 180
|
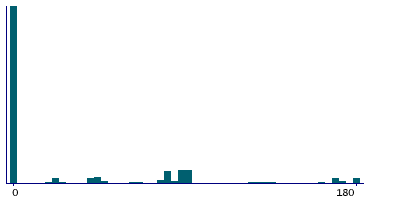
Instance 1 : On-line cycle 1, February 2011 to April 2011.
100,447 participants, 100,447 items
| Maximum | 1320 |
| Decile 9 | 90 |
| Decile 8 | 80 |
| Decile 7 | 22.5 |
| Decile 6 | 0 |
| Median | 0 |
| Decile 4 | 0 |
| Decile 3 | 0 |
| Decile 2 | 0 |
| Decile 1 | 0 |
| Minimum | 0 |
|

|
- Mean = 31.0021
- Std.dev = 58.1774
- 1653 items above graph maximum of 180
|
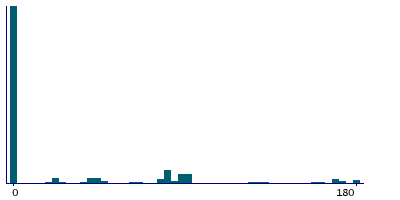
Instance 2 : On-line cycle 2, June 2011 to September 2011.
83,140 participants, 83,140 items
| Maximum | 780 |
| Decile 9 | 90 |
| Decile 8 | 45 |
| Decile 7 | 0 |
| Decile 6 | 0 |
| Median | 0 |
| Decile 4 | 0 |
| Decile 3 | 0 |
| Decile 2 | 0 |
| Decile 1 | 0 |
| Minimum | 0 |
|

|
- Mean = 23.7584
- Std.dev = 50.9104
- 922 items above graph maximum of 180
|
Instance 3 : On-line cycle 3, October 2011 to December 2011.
103,616 participants, 103,616 items
| Maximum | 960 |
| Decile 9 | 90 |
| Decile 8 | 80 |
| Decile 7 | 40 |
| Decile 6 | 0 |
| Median | 0 |
| Decile 4 | 0 |
| Decile 3 | 0 |
| Decile 2 | 0 |
| Decile 1 | 0 |
| Minimum | 0 |
|
|
- Mean = 33.4597
- Std.dev = 60.5846
- 2055 items above graph maximum of 180
|
Instance 4 : On-line cycle 4, April 2012 to June 2012.
100,094 participants, 100,094 items
| Maximum | 1050 |
| Decile 9 | 90 |
| Decile 8 | 80 |
| Decile 7 | 0 |
| Decile 6 | 0 |
| Median | 0 |
| Decile 4 | 0 |
| Decile 3 | 0 |
| Decile 2 | 0 |
| Decile 1 | 0 |
| Minimum | 0 |
|
|
- Mean = 27.8031
- Std.dev = 54.0933
- 1266 items above graph maximum of 180
|
