Data
457,927 items of data are available, covering 210,739 participants.
Defined-instances run from 0 to 4, labelled using Instancing
1.
Units of measurement are g.
| Maximum | 2412 |
| Decile 9 | 222.5 |
| Decile 8 | 165 |
| Decile 7 | 100 |
| Decile 6 | 100 |
| Median | 100 |
| Decile 4 | 30 |
| Decile 3 | 0 |
| Decile 2 | 0 |
| Decile 1 | 0 |
| Minimum | 0 |
|
|
- Mean = 93.2442
- Std.dev = 110.674
- 6093 items above graph maximum of 445
|
5 Instances
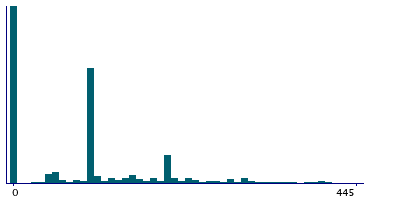
Instance 0 : Conducted in assessment centre, April 2009 to September 2010.
70,630 participants, 70,630 items
| Maximum | 2080 |
| Decile 9 | 230 |
| Decile 8 | 190 |
| Decile 7 | 100 |
| Decile 6 | 100 |
| Median | 100 |
| Decile 4 | 50 |
| Decile 3 | 0 |
| Decile 2 | 0 |
| Decile 1 | 0 |
| Minimum | 0 |
|
|
- Mean = 98.2231
- Std.dev = 115.166
- 920 items above graph maximum of 460
|
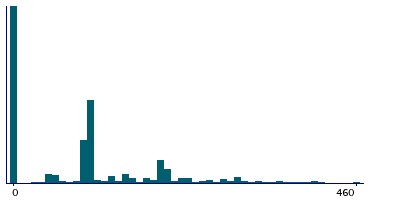
Instance 1 : On-line cycle 1, February 2011 to April 2011.
100,447 participants, 100,447 items
| Maximum | 1654 |
| Decile 9 | 200 |
| Decile 8 | 150 |
| Decile 7 | 100 |
| Decile 6 | 100 |
| Median | 100 |
| Decile 4 | 0 |
| Decile 3 | 0 |
| Decile 2 | 0 |
| Decile 1 | 0 |
| Minimum | 0 |
|
|
- Mean = 88.3771
- Std.dev = 103.989
- 1405 items above graph maximum of 400
|
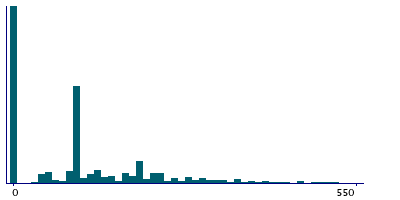
Instance 2 : On-line cycle 2, June 2011 to September 2011.
83,140 participants, 83,140 items
| Maximum | 1889 |
| Decile 9 | 275 |
| Decile 8 | 200 |
| Decile 7 | 130 |
| Decile 6 | 100 |
| Median | 100 |
| Decile 4 | 50 |
| Decile 3 | 0 |
| Decile 2 | 0 |
| Decile 1 | 0 |
| Minimum | 0 |
|
|
- Mean = 109.283
- Std.dev = 126.324
- 731 items above graph maximum of 550
|
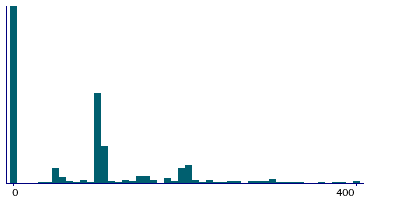
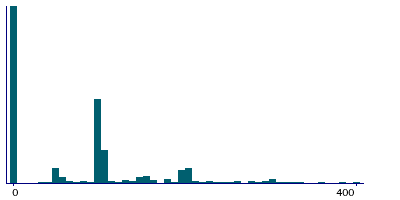
Instance 3 : On-line cycle 3, October 2011 to December 2011.
103,616 participants, 103,616 items
| Maximum | 2412 |
| Decile 9 | 200 |
| Decile 8 | 140 |
| Decile 7 | 100 |
| Decile 6 | 100 |
| Median | 100 |
| Decile 4 | 0 |
| Decile 3 | 0 |
| Decile 2 | 0 |
| Decile 1 | 0 |
| Minimum | 0 |
|
|
- Mean = 82.0928
- Std.dev = 99.8155
- 1169 items above graph maximum of 400
|
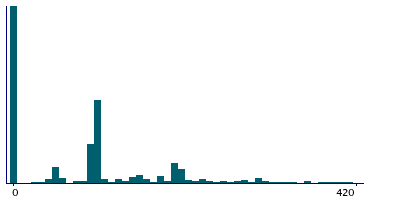
Instance 4 : On-line cycle 4, April 2012 to June 2012.
100,094 participants, 100,094 items
| Maximum | 1550 |
| Decile 9 | 210 |
| Decile 8 | 160 |
| Decile 7 | 100 |
| Decile 6 | 100 |
| Median | 100 |
| Decile 4 | 50 |
| Decile 3 | 0 |
| Decile 2 | 0 |
| Decile 1 | 0 |
| Minimum | 0 |
|
|
- Mean = 92.8366
- Std.dev = 108.969
- 1486 items above graph maximum of 420
|
