Data
457,927 items of data are available, covering 210,739 participants.
Defined-instances run from 0 to 4, labelled using Instancing
1.
Units of measurement are g.
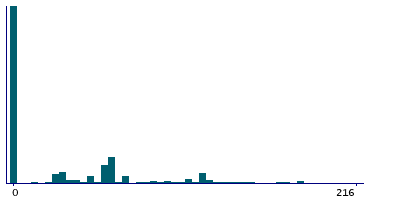
| Maximum | 756 |
| Decile 9 | 108 |
| Decile 8 | 60 |
| Decile 7 | 56 |
| Decile 6 | 28 |
| Median | 0 |
| Decile 4 | 0 |
| Decile 3 | 0 |
| Decile 2 | 0 |
| Decile 1 | 0 |
| Minimum | 0 |
|

|
- Mean = 32.0337
- Std.dev = 50.2291
- 4898 items above graph maximum of 216
|
5 Instances
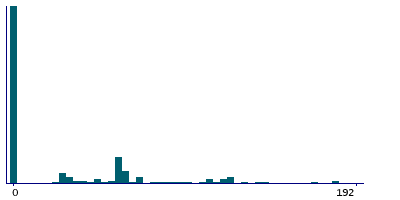
Instance 0 : Conducted in assessment centre, April 2009 to September 2010.
70,630 participants, 70,630 items
| Maximum | 756 |
| Decile 9 | 96 |
| Decile 8 | 60 |
| Decile 7 | 41 |
| Decile 6 | 0 |
| Median | 0 |
| Decile 4 | 0 |
| Decile 3 | 0 |
| Decile 2 | 0 |
| Decile 1 | 0 |
| Minimum | 0 |
|
|
- Mean = 29.0575
- Std.dev = 48.2558
- 825 items above graph maximum of 192
|
Instance 1 : On-line cycle 1, February 2011 to April 2011.
100,447 participants, 100,447 items
| Maximum | 658 |
| Decile 9 | 110 |
| Decile 8 | 60 |
| Decile 7 | 60 |
| Decile 6 | 28 |
| Median | 0 |
| Decile 4 | 0 |
| Decile 3 | 0 |
| Decile 2 | 0 |
| Decile 1 | 0 |
| Minimum | 0 |
|

|
- Mean = 33.9202
- Std.dev = 54.4997
- 1554 items above graph maximum of 220
|
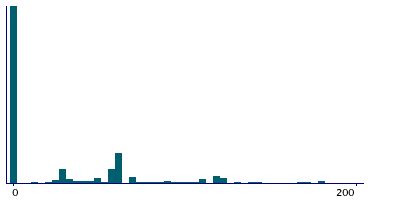
Instance 2 : On-line cycle 2, June 2011 to September 2011.
83,140 participants, 83,140 items
| Maximum | 635 |
| Decile 9 | 100 |
| Decile 8 | 60 |
| Decile 7 | 48 |
| Decile 6 | 28 |
| Median | 0 |
| Decile 4 | 0 |
| Decile 3 | 0 |
| Decile 2 | 0 |
| Decile 1 | 0 |
| Minimum | 0 |
|
|
- Mean = 30.9623
- Std.dev = 48.0036
- 797 items above graph maximum of 200
|
Instance 3 : On-line cycle 3, October 2011 to December 2011.
103,616 participants, 103,616 items
| Maximum | 560 |
| Decile 9 | 110 |
| Decile 8 | 60 |
| Decile 7 | 60 |
| Decile 6 | 28 |
| Median | 0 |
| Decile 4 | 0 |
| Decile 3 | 0 |
| Decile 2 | 0 |
| Decile 1 | 0 |
| Minimum | 0 |
|

|
- Mean = 32.7145
- Std.dev = 49.4927
- 945 items above graph maximum of 220
|
Instance 4 : On-line cycle 4, April 2012 to June 2012.
100,094 participants, 100,094 items
| Maximum | 670 |
| Decile 9 | 108 |
| Decile 8 | 60 |
| Decile 7 | 58 |
| Decile 6 | 28 |
| Median | 0 |
| Decile 4 | 0 |
| Decile 3 | 0 |
| Decile 2 | 0 |
| Decile 1 | 0 |
| Minimum | 0 |
|
|
- Mean = 32.4261
- Std.dev = 49.5731
- 955 items above graph maximum of 216
|
