Data
457,927 items of data are available, covering 210,739 participants.
Defined-instances run from 0 to 4, labelled using Instancing
1.
Units of measurement are g.
| Maximum | 290 |
| Decile 9 | 41 |
| Decile 8 | 34 |
| Decile 7 | 17 |
| Decile 6 | 0 |
| Median | 0 |
| Decile 4 | 0 |
| Decile 3 | 0 |
| Decile 2 | 0 |
| Decile 1 | 0 |
| Minimum | 0 |
|

|
- Mean = 12.253
- Std.dev = 21.4802
- 7747 items above graph maximum of 82
|
5 Instances
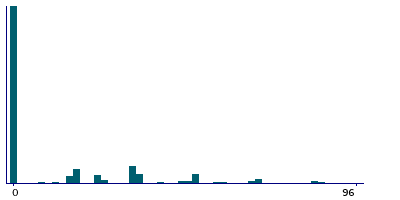
Instance 0 : Conducted in assessment centre, April 2009 to September 2010.
70,630 participants, 70,630 items
| Maximum | 256 |
| Decile 9 | 48 |
| Decile 8 | 34 |
| Decile 7 | 17 |
| Decile 6 | 0 |
| Median | 0 |
| Decile 4 | 0 |
| Decile 3 | 0 |
| Decile 2 | 0 |
| Decile 1 | 0 |
| Minimum | 0 |
|
|
- Mean = 12.379
- Std.dev = 21.9979
- 379 items above graph maximum of 96
|
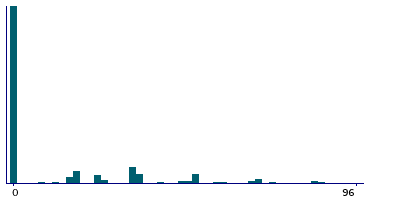
Instance 1 : On-line cycle 1, February 2011 to April 2011.
100,447 participants, 100,447 items
| Maximum | 239 |
| Decile 9 | 48 |
| Decile 8 | 34 |
| Decile 7 | 17 |
| Decile 6 | 0 |
| Median | 0 |
| Decile 4 | 0 |
| Decile 3 | 0 |
| Decile 2 | 0 |
| Decile 1 | 0 |
| Minimum | 0 |
|
|
- Mean = 12.6733
- Std.dev = 21.7371
- 534 items above graph maximum of 96
|
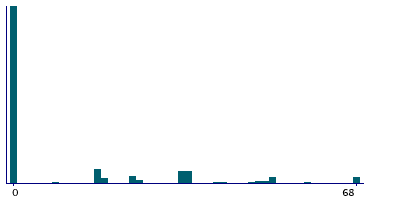
Instance 2 : On-line cycle 2, June 2011 to September 2011.
83,140 participants, 83,140 items
| Maximum | 290 |
| Decile 9 | 34 |
| Decile 8 | 24 |
| Decile 7 | 17 |
| Decile 6 | 0 |
| Median | 0 |
| Decile 4 | 0 |
| Decile 3 | 0 |
| Decile 2 | 0 |
| Decile 1 | 0 |
| Minimum | 0 |
|
|
- Mean = 11.7181
- Std.dev = 21.1829
- 1795 items above graph maximum of 68
|
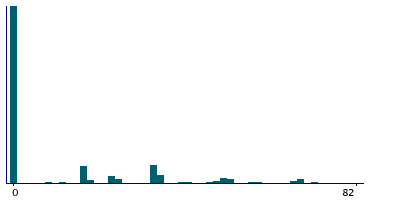
Instance 3 : On-line cycle 3, October 2011 to December 2011.
103,616 participants, 103,616 items
| Maximum | 218 |
| Decile 9 | 41 |
| Decile 8 | 34 |
| Decile 7 | 17 |
| Decile 6 | 0 |
| Median | 0 |
| Decile 4 | 0 |
| Decile 3 | 0 |
| Decile 2 | 0 |
| Decile 1 | 0 |
| Minimum | 0 |
|

|
- Mean = 12.1862
- Std.dev = 21.2184
- 1661 items above graph maximum of 82
|
Instance 4 : On-line cycle 4, April 2012 to June 2012.
100,094 participants, 100,094 items
| Maximum | 290 |
| Decile 9 | 41 |
| Decile 8 | 34 |
| Decile 7 | 17 |
| Decile 6 | 0 |
| Median | 0 |
| Decile 4 | 0 |
| Decile 3 | 0 |
| Decile 2 | 0 |
| Decile 1 | 0 |
| Minimum | 0 |
|
|
- Mean = 12.2555
- Std.dev = 21.3554
- 1629 items above graph maximum of 82
|
