Data
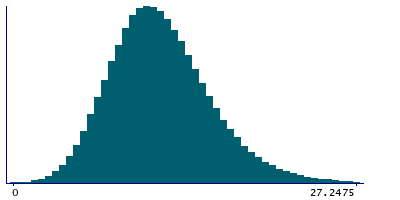
457,927 items of data are available, covering 210,739 participants.
Defined-instances run from 0 to 4, labelled using Instancing
1.
Units of measurement are mg.
| Maximum | 110.685 |
| Decile 9 | 17.0577 |
| Decile 8 | 14.899 |
| Decile 7 | 13.4966 |
| Decile 6 | 12.3664 |
| Median | 11.3658 |
| Decile 4 | 10.4083 |
| Decile 3 | 9.43716 |
| Decile 2 | 8.33479 |
| Decile 1 | 6.86652 |
| Minimum | 0 |
|
|
- Mean = 11.7618
- Std.dev = 4.18788
- 1526 items above graph maximum of 27.2489
|
5 Instances
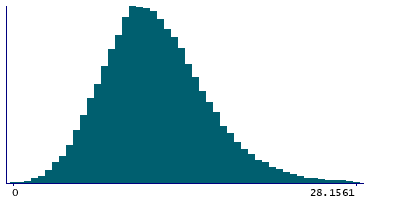
Instance 0 : Conducted in assessment centre, April 2009 to September 2010.
70,630 participants, 70,630 items
| Maximum | 110.685 |
| Decile 9 | 17.3495 |
| Decile 8 | 15.0798 |
| Decile 7 | 13.5907 |
| Decile 6 | 12.4019 |
| Median | 11.3308 |
| Decile 4 | 10.3089 |
| Decile 3 | 9.29608 |
| Decile 2 | 8.13057 |
| Decile 1 | 6.54459 |
| Minimum | 0 |
|
|
- Mean = 11.7591
- Std.dev = 4.4694
- 271 items above graph maximum of 28.1545
|
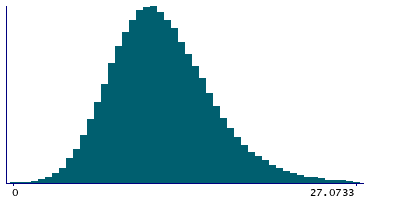
Instance 1 : On-line cycle 1, February 2011 to April 2011.
100,447 participants, 100,447 items
| Maximum | 56.8633 |
| Decile 9 | 17.0234 |
| Decile 8 | 14.9061 |
| Decile 7 | 13.5226 |
| Decile 6 | 12.396 |
| Median | 11.3959 |
| Decile 4 | 10.4541 |
| Decile 3 | 9.49088 |
| Decile 2 | 8.39779 |
| Decile 1 | 6.97386 |
| Minimum | 0 |
|
|
- Mean = 11.7938
- Std.dev = 4.12383
- 313 items above graph maximum of 27.0729
|
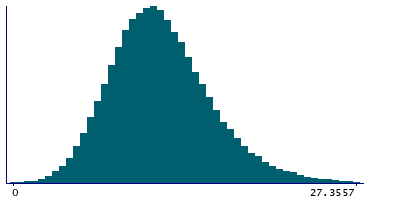
Instance 2 : On-line cycle 2, June 2011 to September 2011.
83,140 participants, 83,140 items
| Maximum | 83.2482 |
| Decile 9 | 17.1552 |
| Decile 8 | 14.9715 |
| Decile 7 | 13.5603 |
| Decile 6 | 12.433 |
| Median | 11.4471 |
| Decile 4 | 10.4985 |
| Decile 3 | 9.51858 |
| Decile 2 | 8.42686 |
| Decile 1 | 6.9475 |
| Minimum | 0 |
|
|
- Mean = 11.8354
- Std.dev = 4.1713
- 255 items above graph maximum of 27.363
|
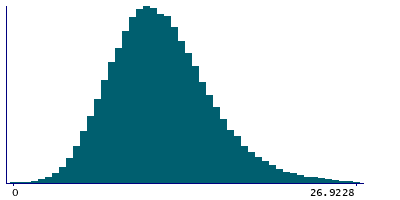
Instance 3 : On-line cycle 3, October 2011 to December 2011.
103,616 participants, 103,616 items
| Maximum | 71.1357 |
| Decile 9 | 16.8907 |
| Decile 8 | 14.7627 |
| Decile 7 | 13.3888 |
| Decile 6 | 12.2861 |
| Median | 11.2907 |
| Decile 4 | 10.3432 |
| Decile 3 | 9.38501 |
| Decile 2 | 8.29335 |
| Decile 1 | 6.85917 |
| Minimum | 0 |
|
|
- Mean = 11.676
- Std.dev = 4.09666
- 320 items above graph maximum of 26.9223
|
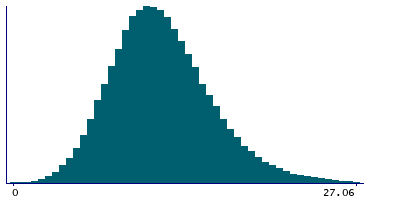
Instance 4 : On-line cycle 4, April 2012 to June 2012.
100,094 participants, 100,094 items
| Maximum | 91.7163 |
| Decile 9 | 16.9852 |
| Decile 8 | 14.8442 |
| Decile 7 | 13.4625 |
| Decile 6 | 12.3451 |
| Median | 11.3688 |
| Decile 4 | 10.4251 |
| Decile 3 | 9.46405 |
| Decile 2 | 8.38497 |
| Decile 1 | 6.9124 |
| Minimum | 0 |
|
|
- Mean = 11.7591
- Std.dev = 4.15177
- 348 items above graph maximum of 27.0581
|


