Data
457,927 items of data are available, covering 210,739 participants.
Defined-instances run from 0 to 4, labelled using Instancing
1.
Units of measurement are mg.
| Maximum | 41.2519 |
| Decile 9 | 6.41025 |
| Decile 8 | 5.52166 |
| Decile 7 | 4.94451 |
| Decile 6 | 4.48527 |
| Median | 4.07952 |
| Decile 4 | 3.69047 |
| Decile 3 | 3.2906 |
| Decile 2 | 2.84806 |
| Decile 1 | 2.28073 |
| Minimum | 0 |
|
|
- Mean = 4.25319
- Std.dev = 1.68904
- 1560 items above graph maximum of 10.5398
|
5 Instances
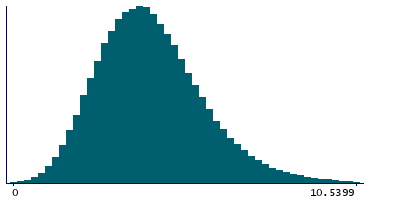
Instance 0 : Conducted in assessment centre, April 2009 to September 2010.
70,630 participants, 70,630 items
| Maximum | 41.2519 |
| Decile 9 | 6.5339 |
| Decile 8 | 5.58437 |
| Decile 7 | 4.97469 |
| Decile 6 | 4.49435 |
| Median | 4.0678 |
| Decile 4 | 3.66101 |
| Decile 3 | 3.24387 |
| Decile 2 | 2.79375 |
| Decile 1 | 2.20095 |
| Minimum | 0 |
|
|
- Mean = 4.26385
- Std.dev = 1.78348
- 266 items above graph maximum of 10.8668
|
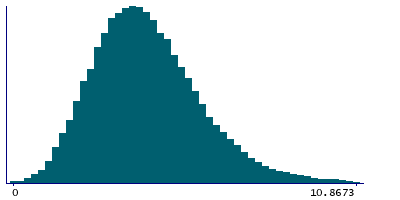
Instance 1 : On-line cycle 1, February 2011 to April 2011.
100,447 participants, 100,447 items
| Maximum | 20.9015 |
| Decile 9 | 6.39654 |
| Decile 8 | 5.51401 |
| Decile 7 | 4.9457 |
| Decile 6 | 4.49185 |
| Median | 4.08952 |
| Decile 4 | 3.71224 |
| Decile 3 | 3.31514 |
| Decile 2 | 2.87515 |
| Decile 1 | 2.31336 |
| Minimum | 0 |
|

|
- Mean = 4.26405
- Std.dev = 1.66932
- 319 items above graph maximum of 10.4797
|
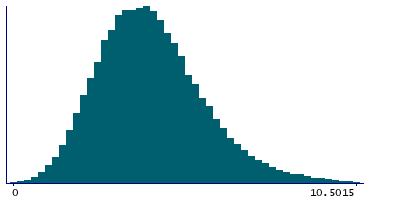
Instance 2 : On-line cycle 2, June 2011 to September 2011.
83,140 participants, 83,140 items
| Maximum | 26.7985 |
| Decile 9 | 6.38428 |
| Decile 8 | 5.50347 |
| Decile 7 | 4.92663 |
| Decile 6 | 4.47097 |
| Median | 4.07196 |
| Decile 4 | 3.6748 |
| Decile 3 | 3.27684 |
| Decile 2 | 2.83684 |
| Decile 1 | 2.26672 |
| Minimum | 0 |
|
|
- Mean = 4.23679
- Std.dev = 1.68063
- 293 items above graph maximum of 10.5018
|
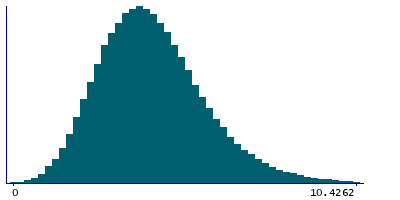
Instance 3 : On-line cycle 3, October 2011 to December 2011.
103,616 participants, 103,616 items
| Maximum | 25.4419 |
| Decile 9 | 6.35944 |
| Decile 8 | 5.47998 |
| Decile 7 | 4.92107 |
| Decile 6 | 4.46635 |
| Median | 4.06426 |
| Decile 4 | 3.68242 |
| Decile 3 | 3.28873 |
| Decile 2 | 2.84726 |
| Decile 1 | 2.29207 |
| Minimum | 0 |
|
|
- Mean = 4.2333
- Std.dev = 1.65541
- 314 items above graph maximum of 10.4268
|
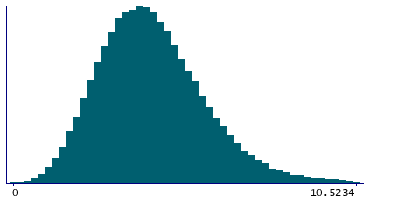
Instance 4 : On-line cycle 4, April 2012 to June 2012.
100,094 participants, 100,094 items
| Maximum | 35.1368 |
| Decile 9 | 6.41431 |
| Decile 8 | 5.53933 |
| Decile 7 | 4.96084 |
| Decile 6 | 4.5048 |
| Median | 4.10013 |
| Decile 4 | 3.71236 |
| Decile 3 | 3.30825 |
| Decile 2 | 2.8701 |
| Decile 1 | 2.30537 |
| Minimum | 0 |
|
|
- Mean = 4.26901
- Std.dev = 1.6813
- 348 items above graph maximum of 10.5233
|
