Data
457,927 items of data are available, covering 210,739 participants.
Defined-instances run from 0 to 4, labelled using Instancing
1.
Units of measurement are g.
| Maximum | 404.485 |
| Decile 9 | 48.7234 |
| Decile 8 | 39.8541 |
| Decile 7 | 34.2565 |
| Decile 6 | 29.8596 |
| Median | 26.0289 |
| Decile 4 | 22.4149 |
| Decile 3 | 18.8169 |
| Decile 2 | 14.8663 |
| Decile 1 | 10.0709 |
| Minimum | 0 |
|
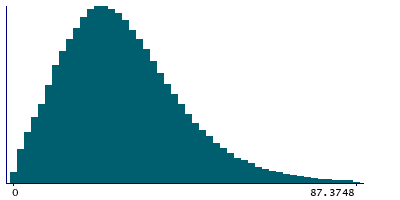
|
- Mean = 28.2865
- Std.dev = 16.2015
- 2480 items above graph maximum of 87.3759
|
5 Instances
Instance 0 : Conducted in assessment centre, April 2009 to September 2010.
70,630 participants, 70,630 items
| Maximum | 404.485 |
| Decile 9 | 50.7926 |
| Decile 8 | 41.126 |
| Decile 7 | 35.0381 |
| Decile 6 | 30.3475 |
| Median | 26.289 |
| Decile 4 | 22.41 |
| Decile 3 | 18.607 |
| Decile 2 | 14.4757 |
| Decile 1 | 9.48745 |
| Minimum | 0 |
|
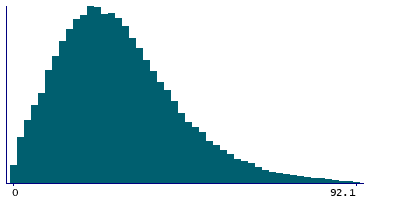
|
- Mean = 28.8882
- Std.dev = 17.6889
- 443 items above graph maximum of 92.0977
|
Instance 1 : On-line cycle 1, February 2011 to April 2011.
100,447 participants, 100,447 items
| Maximum | 189.327 |
| Decile 9 | 49.0549 |
| Decile 8 | 40.246 |
| Decile 7 | 34.5857 |
| Decile 6 | 30.1483 |
| Median | 26.2909 |
| Decile 4 | 22.6335 |
| Decile 3 | 18.9746 |
| Decile 2 | 15.0088 |
| Decile 1 | 10.1597 |
| Minimum | 0 |
|
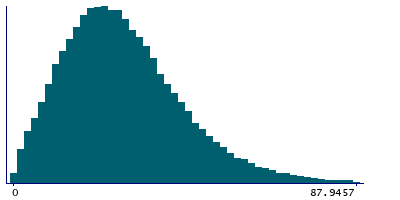
|
- Mean = 28.4972
- Std.dev = 16.1485
- 501 items above graph maximum of 87.95
|
Instance 2 : On-line cycle 2, June 2011 to September 2011.
83,140 participants, 83,140 items
| Maximum | 257.2 |
| Decile 9 | 48.2489 |
| Decile 8 | 39.5065 |
| Decile 7 | 34.0887 |
| Decile 6 | 29.8404 |
| Median | 26.0921 |
| Decile 4 | 22.6076 |
| Decile 3 | 19.0934 |
| Decile 2 | 15.2416 |
| Decile 1 | 10.5078 |
| Minimum | 0 |
|
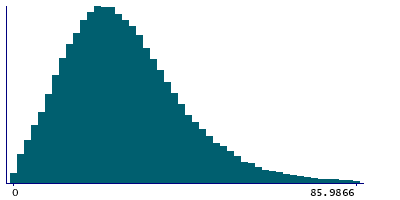
|
- Mean = 28.2862
- Std.dev = 15.8214
- 456 items above graph maximum of 85.99
|
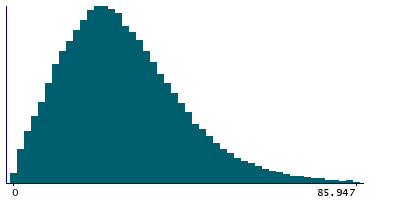
Instance 3 : On-line cycle 3, October 2011 to December 2011.
103,616 participants, 103,616 items
| Maximum | 206.078 |
| Decile 9 | 47.8827 |
| Decile 8 | 39.2793 |
| Decile 7 | 33.7602 |
| Decile 6 | 29.4209 |
| Median | 25.5888 |
| Decile 4 | 22.0336 |
| Decile 3 | 18.5149 |
| Decile 2 | 14.575 |
| Decile 1 | 9.82773 |
| Minimum | 0 |
|
|
- Mean = 27.791
- Std.dev = 15.8052
- 546 items above graph maximum of 85.9376
|
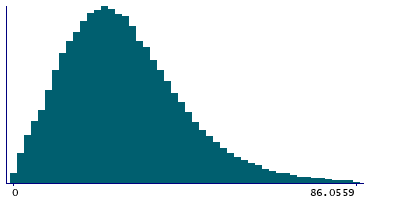
Instance 4 : On-line cycle 4, April 2012 to June 2012.
100,094 participants, 100,094 items
| Maximum | 383.185 |
| Decile 9 | 48.1603 |
| Decile 8 | 39.5061 |
| Decile 7 | 34.0595 |
| Decile 6 | 29.7316 |
| Median | 26.0082 |
| Decile 4 | 22.472 |
| Decile 3 | 18.8886 |
| Decile 2 | 14.9915 |
| Decile 1 | 10.2659 |
| Minimum | 0 |
|
|
- Mean = 28.1637
- Std.dev = 15.8528
- 540 items above graph maximum of 86.0546
|


